Tempas
Tempas is a complete rewrite of MacTempas. As Tempas relies on QT as a development platform, it became possible to create a Windows version at the same time as developing for the macOS. Tempas keeps the functionality of MacTempas intact, and as such, anyone knowing how to operate MacTempas will feel familiar with the operation of Tempas. Yet the entire Graphical User Interface (GUI) has been completely rewritten, and Tempas adds functionality that would not have been possible within MacTempas. Many operations take advantage of multiple CPU cores and hence many operations are sped up accordingly.
Short Highlight of Tempas Features
- Full multislice calculation of High Resolution TEM Images and Dynamical Diffraction Patterns
- Full multislice calculation of High Resolution STEM images
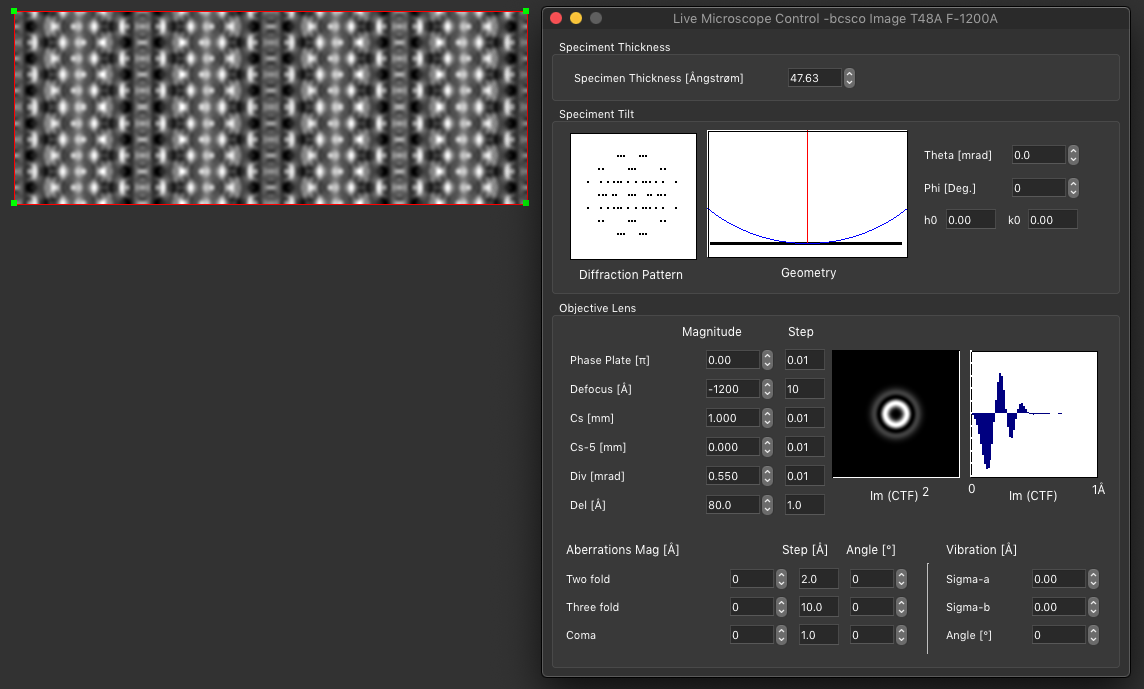
- "Live" control of calculated HRTEM image and exit wave as a function of simulation parameters
- Calculation of kinematical SAD patterns and Kikuchi patterns
- Calculation of kinematical CBED patterns
- Bloch wave calculation of CBED patterns
- Ring patterns
- Automatic calculation of HRTEM tilt series
- Full quantitative comparison of simulated and experimental images
- Structure and microscope parameter refinement based on quantitative image match
- Reciprocal space tables, plane spacing, and angle calculator
- Full image manipulation
- All basic image processing features
- Advanced image processing features, real space, reciprocal space filters, masks, noise filters, etc.
- Peak finding, peak fitting, and lattice fitting
- Template matching for pattern search
- Real and reciprocal space displacement and strain analysis
- Crystallographic image processing
- Diffraction pattern quantification
- Motif extraction and averaging with noise estimation
- Full reverse polish notation image calculator
- Image alignment
- Focus determination
- Supports reading Gatan Digital Micrograph images (image data and calibration)
- Optional Digital Micrograph compatible scripting language
- Optional exit wave and object reconstruction package
- Plus many more features...
Optional Modules
Exit Wave and Object Reconstruction
Scripting Language
Example Screen Shots from Tempas
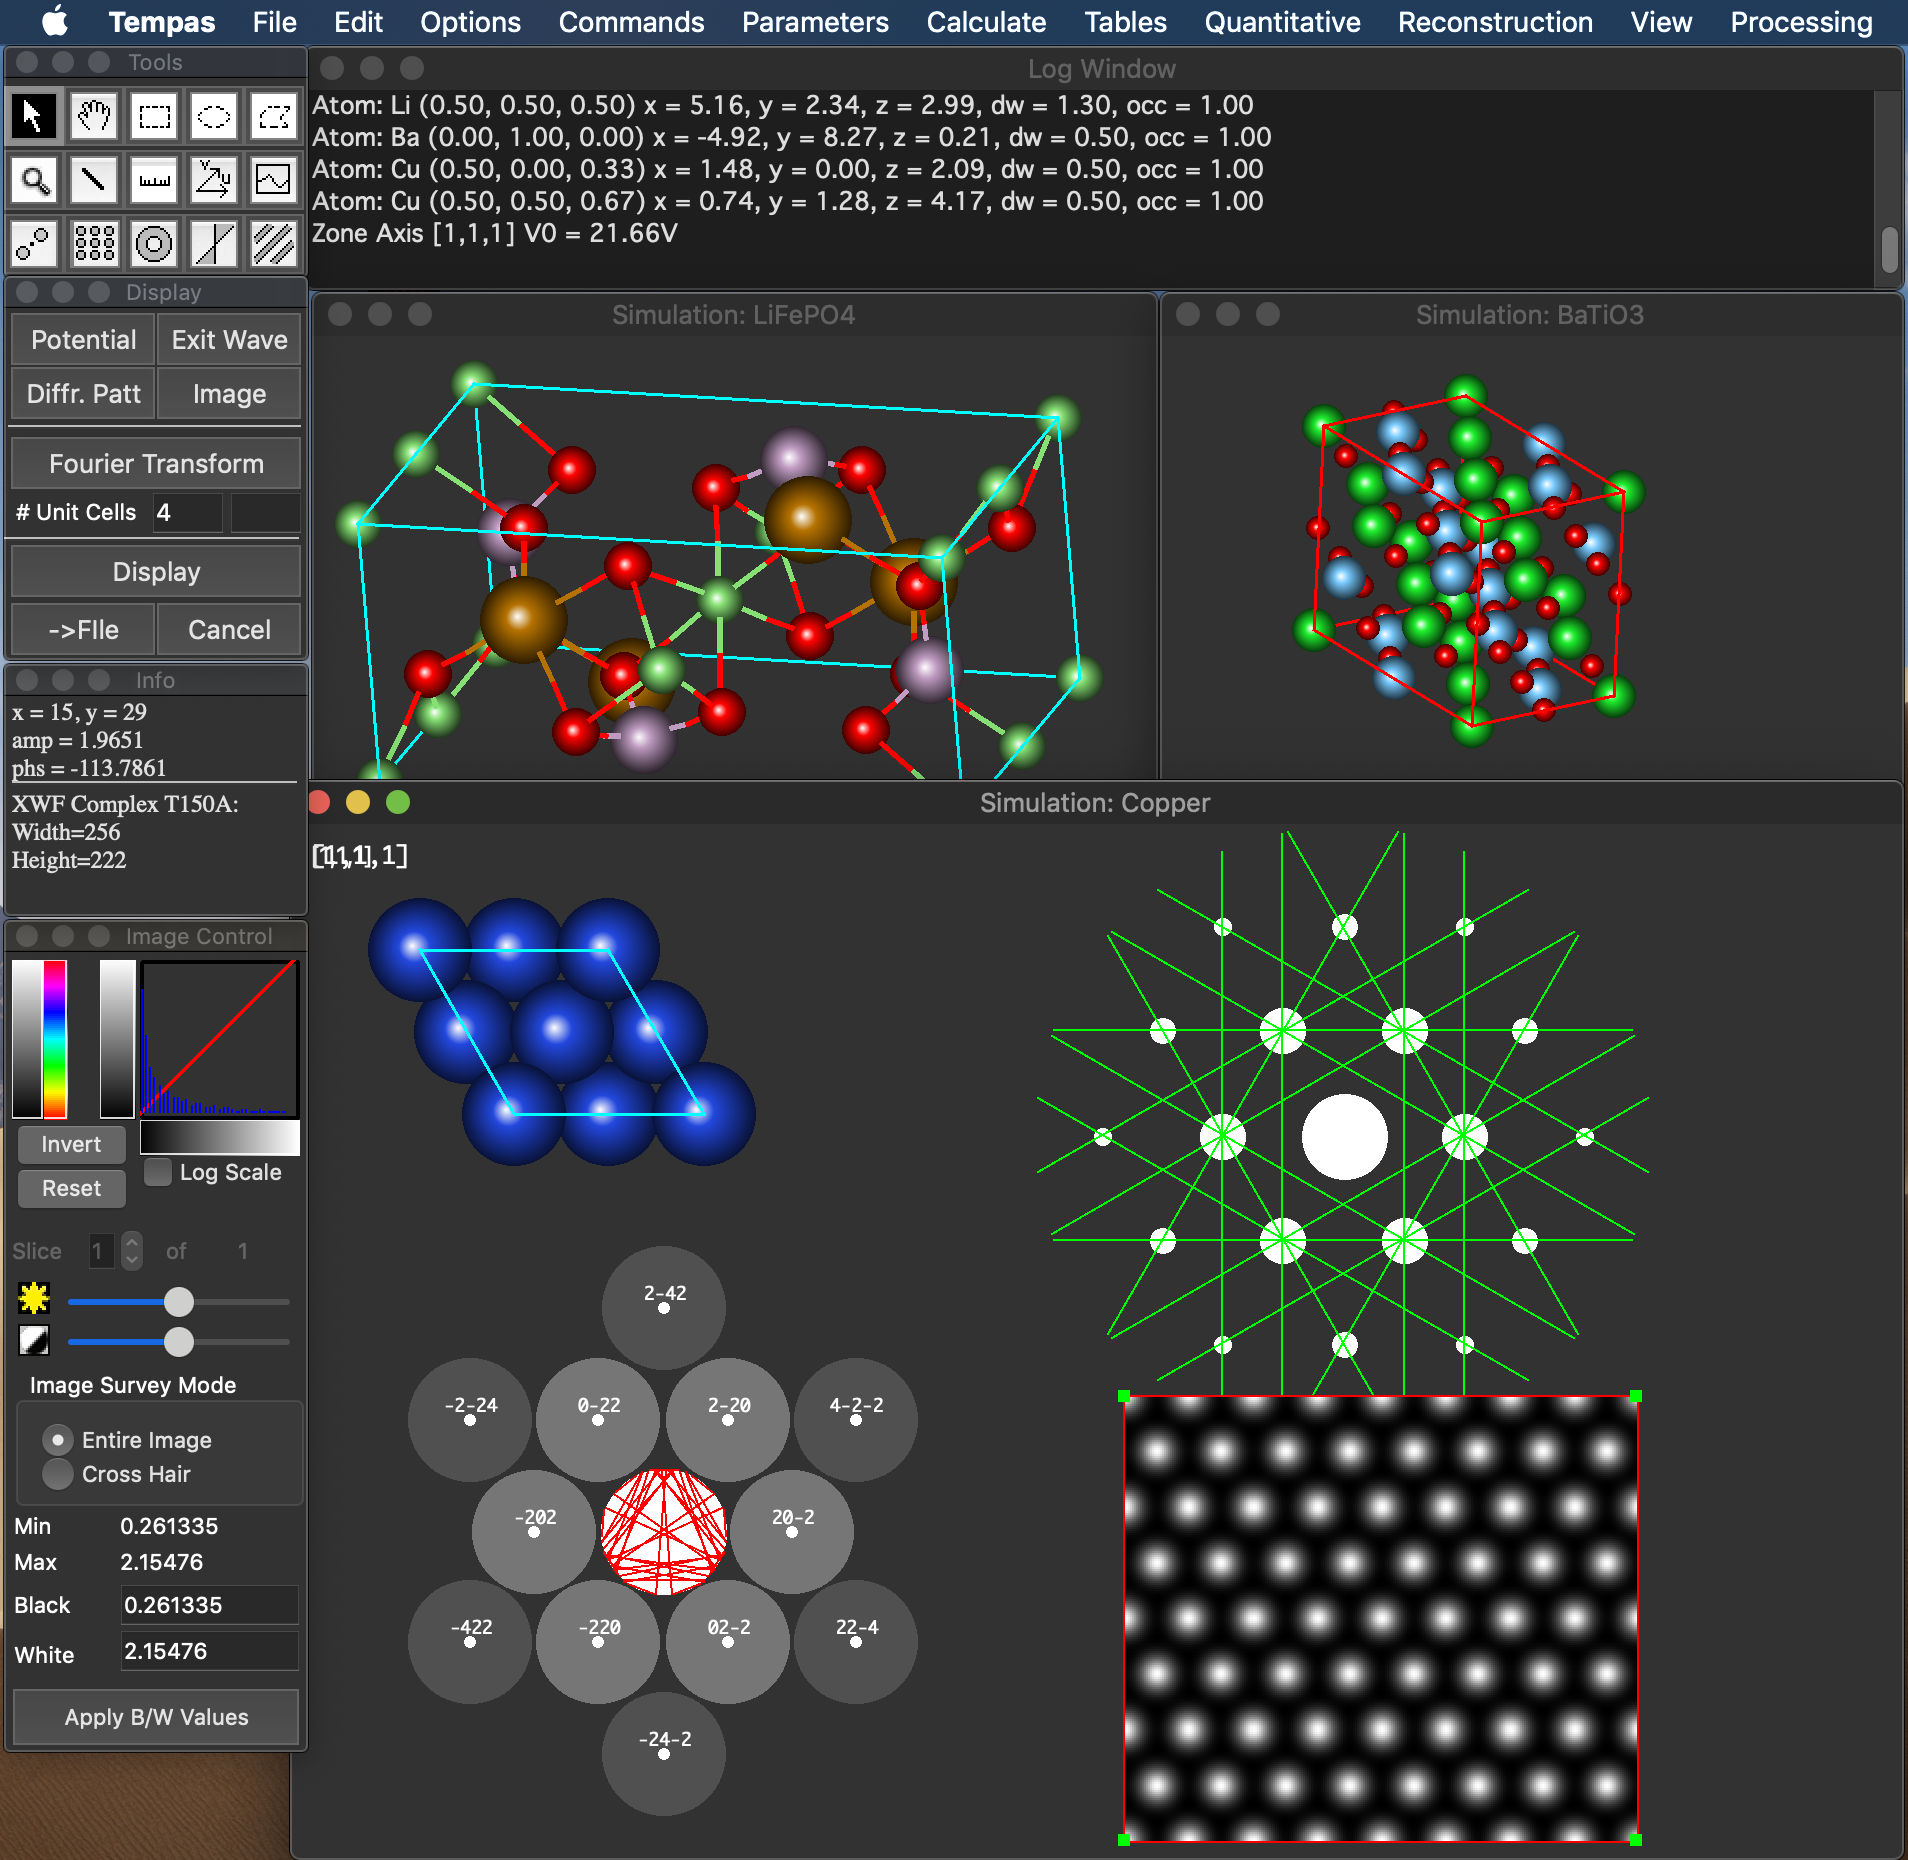
Main Display Window showing some examples of calculated data from a given atomistic model
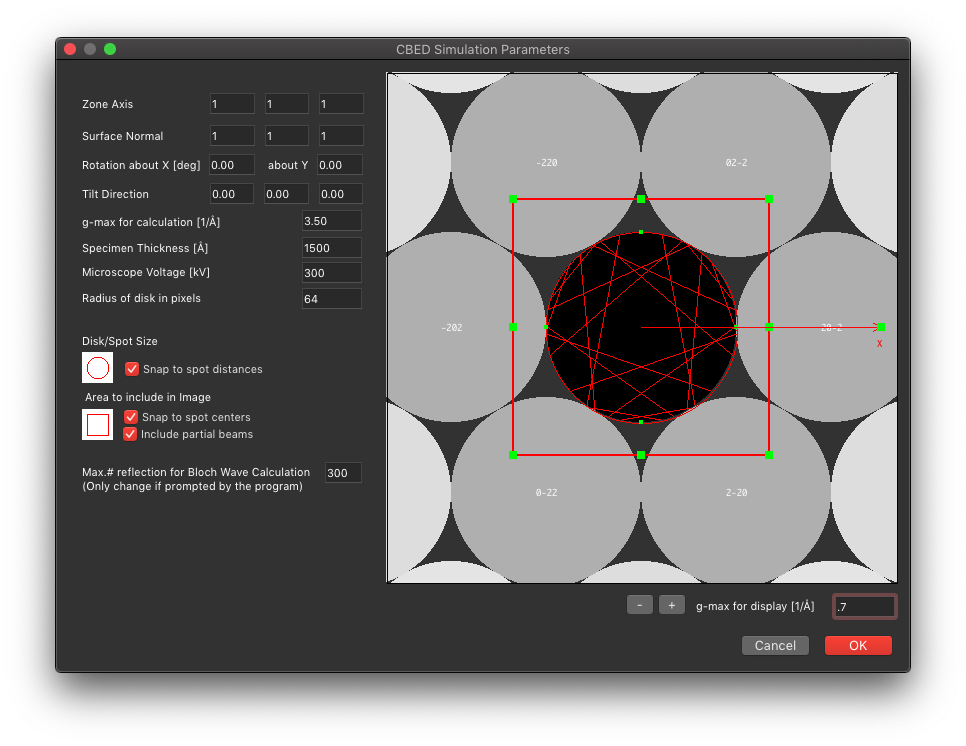
Starting point for computing a CBED Pattern
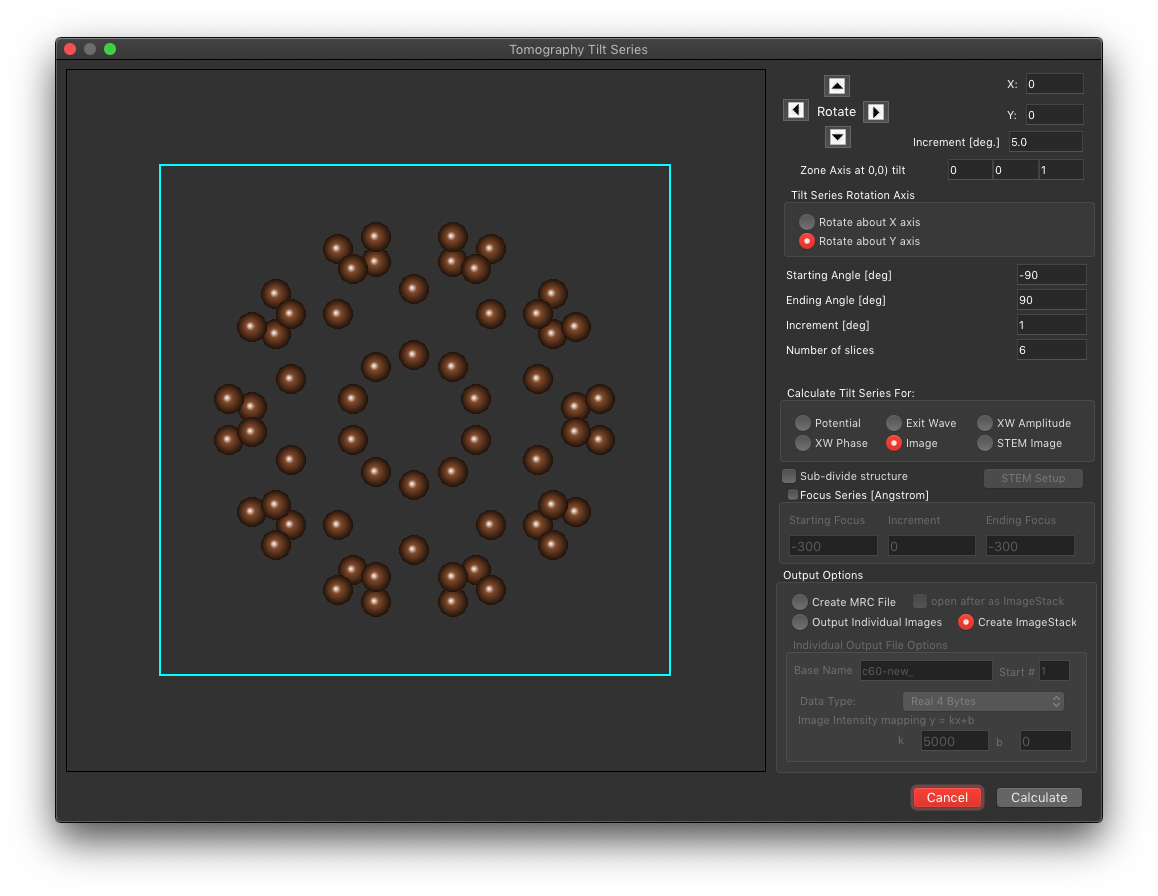
Starting point for computing a Tomographic Tilt Series
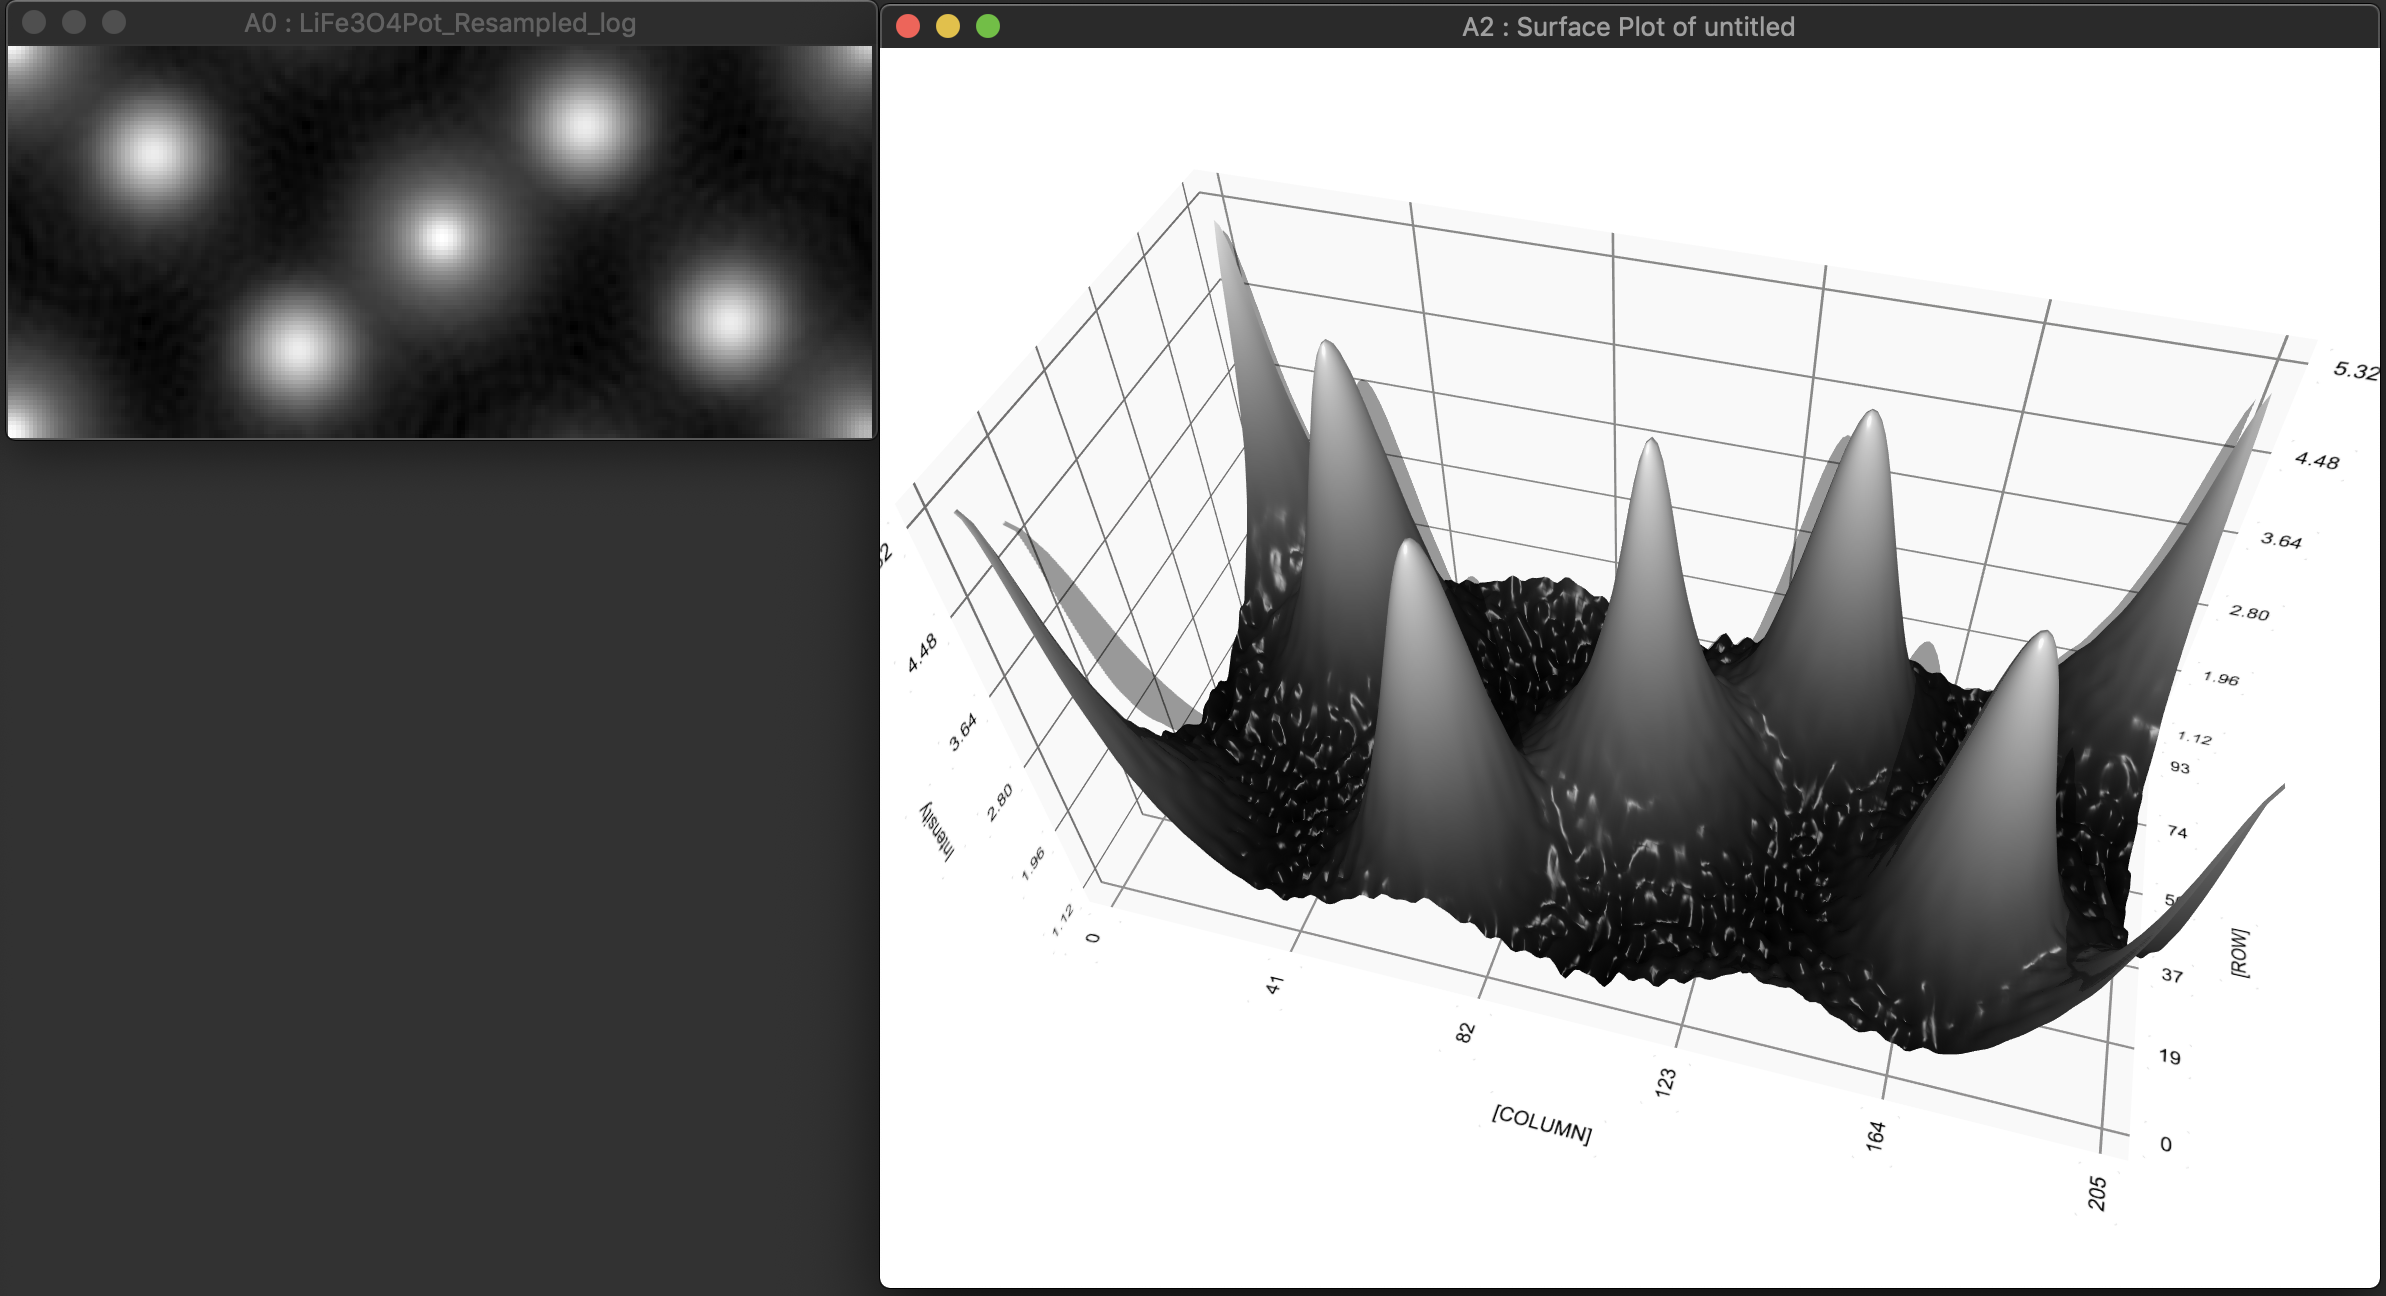
The image on the left is the first image in a 3D ImageVolume representing the log of the 3D electrostatic potential in a unit cell of LiFe3O4. To the right is a surface plot of the same
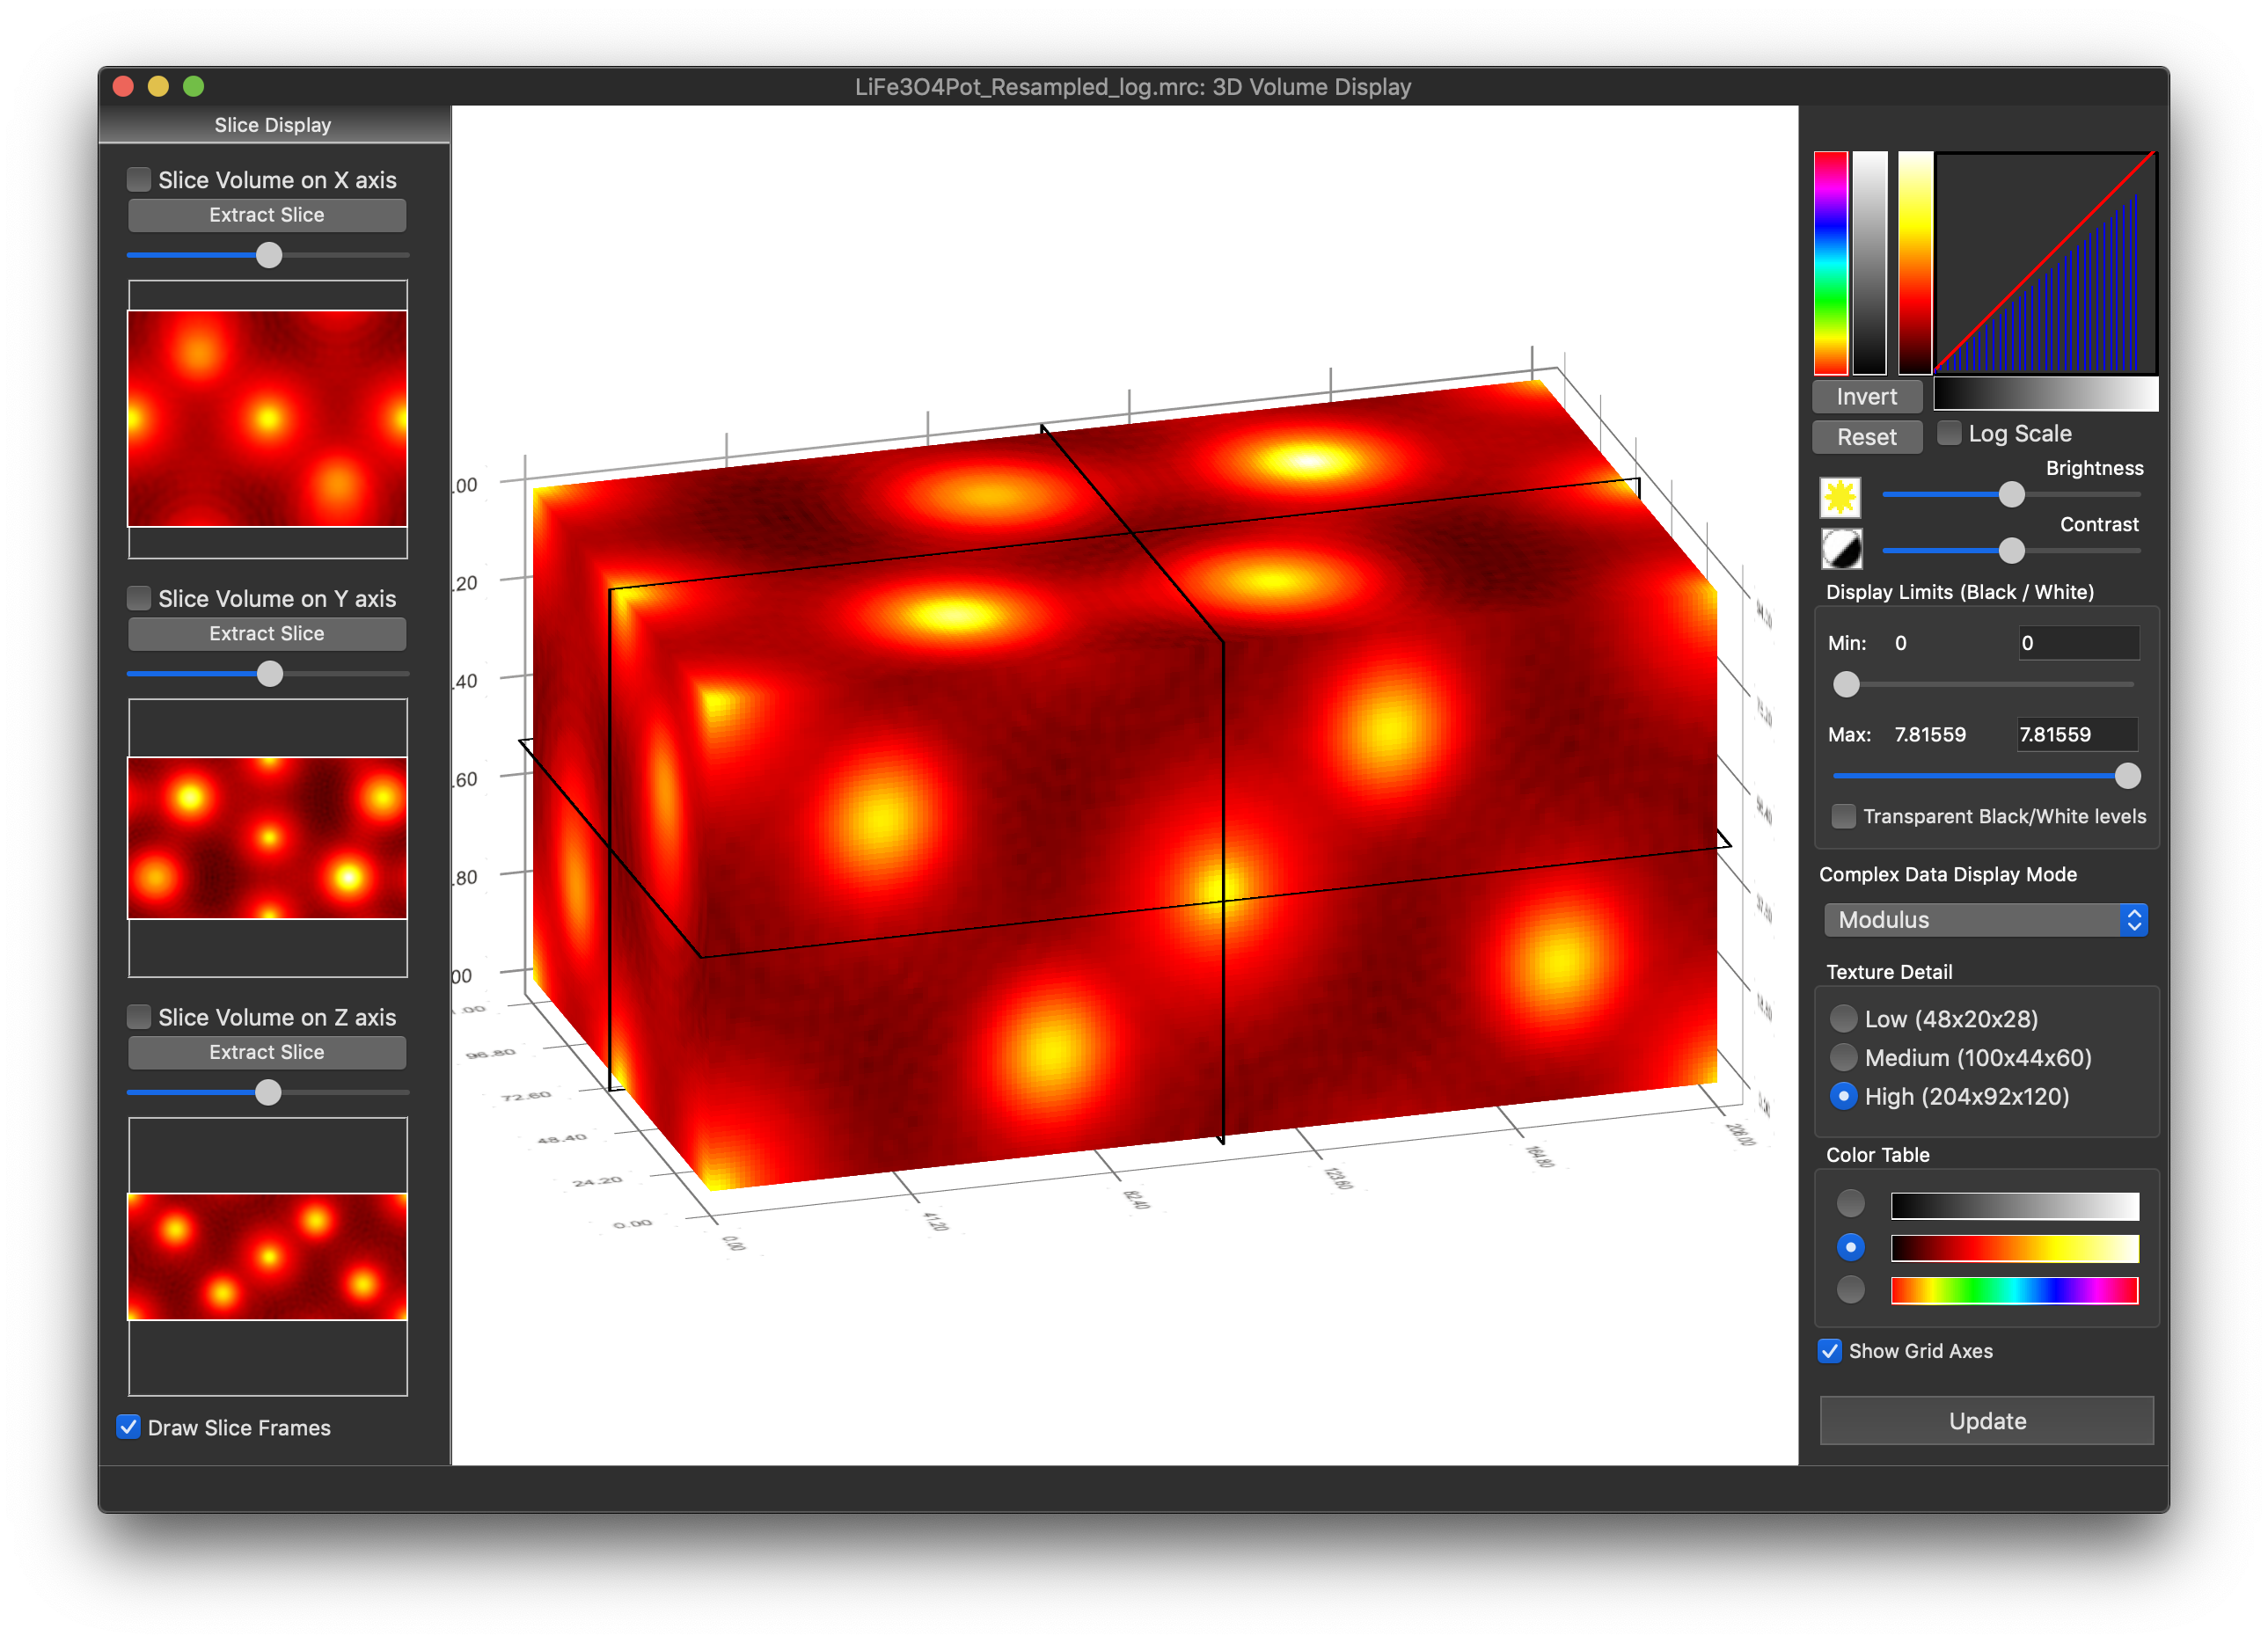
The 3D electrostatic potential can be represented in various ways. The above interface allows for the volume to be sliced in different directions.
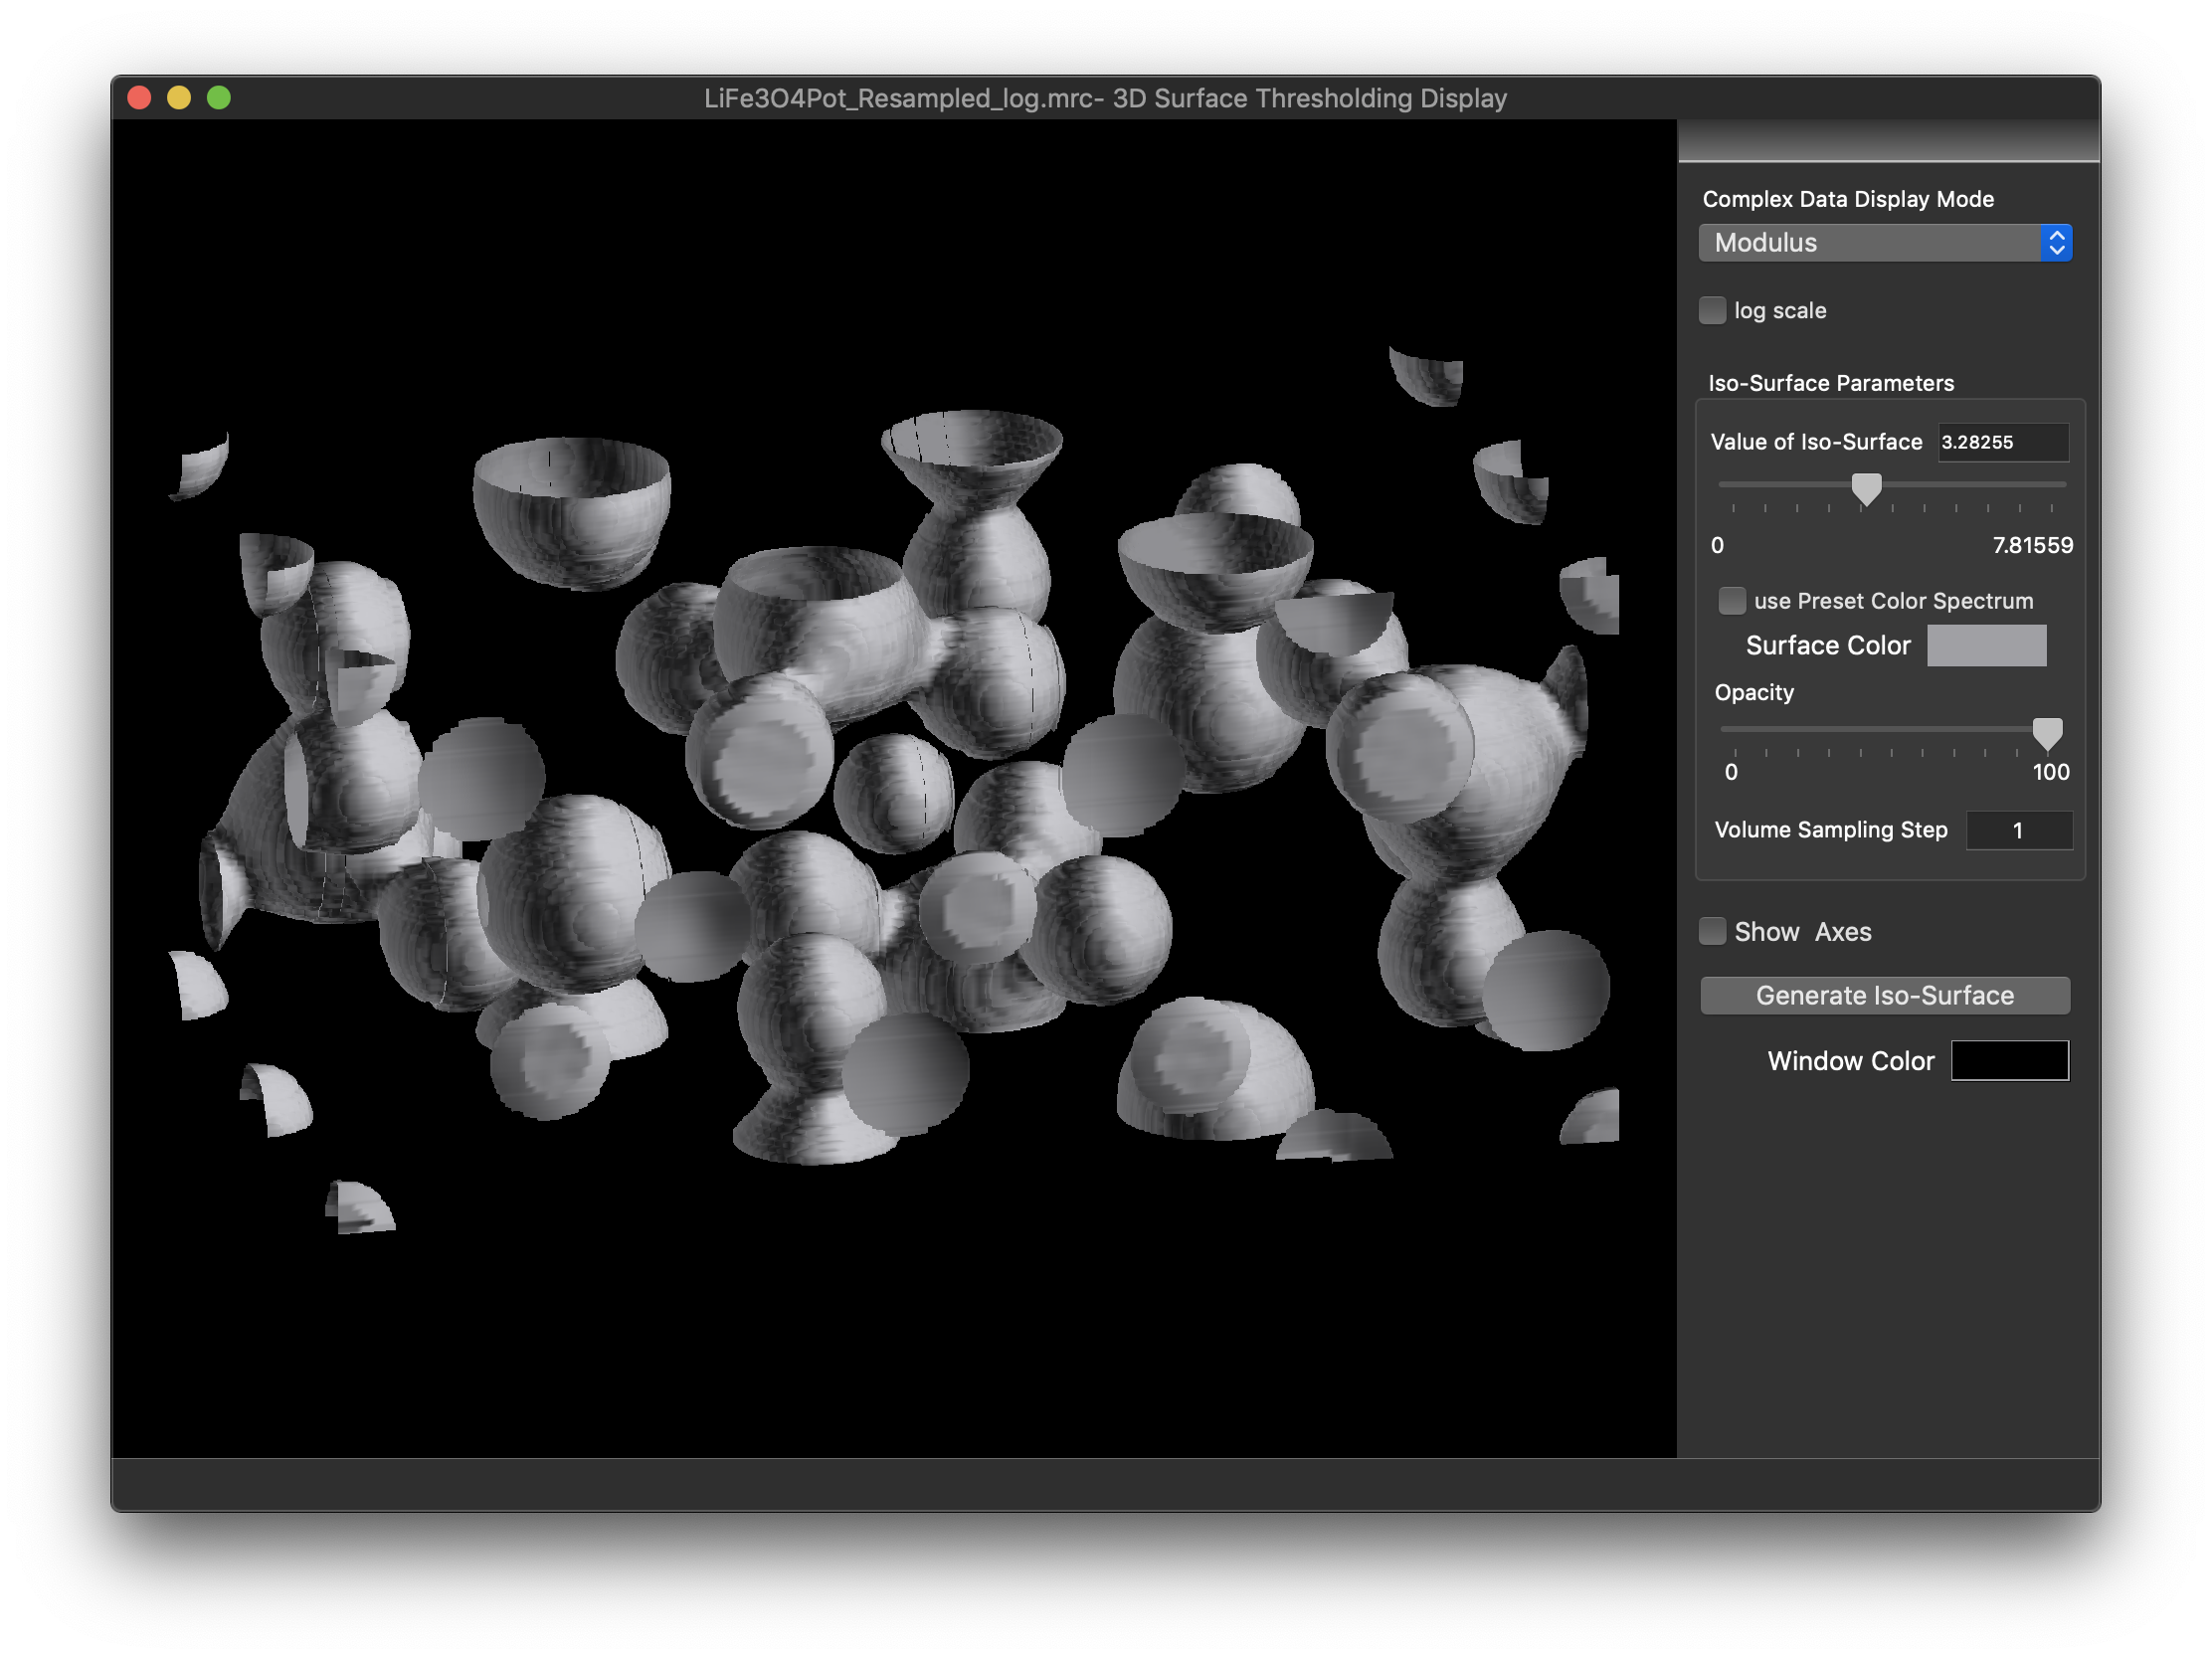
The same 3D potential can also be represented in terms of an ISO-Surface, where the surface is drawn where the value of the potential corresponds to a given input value.
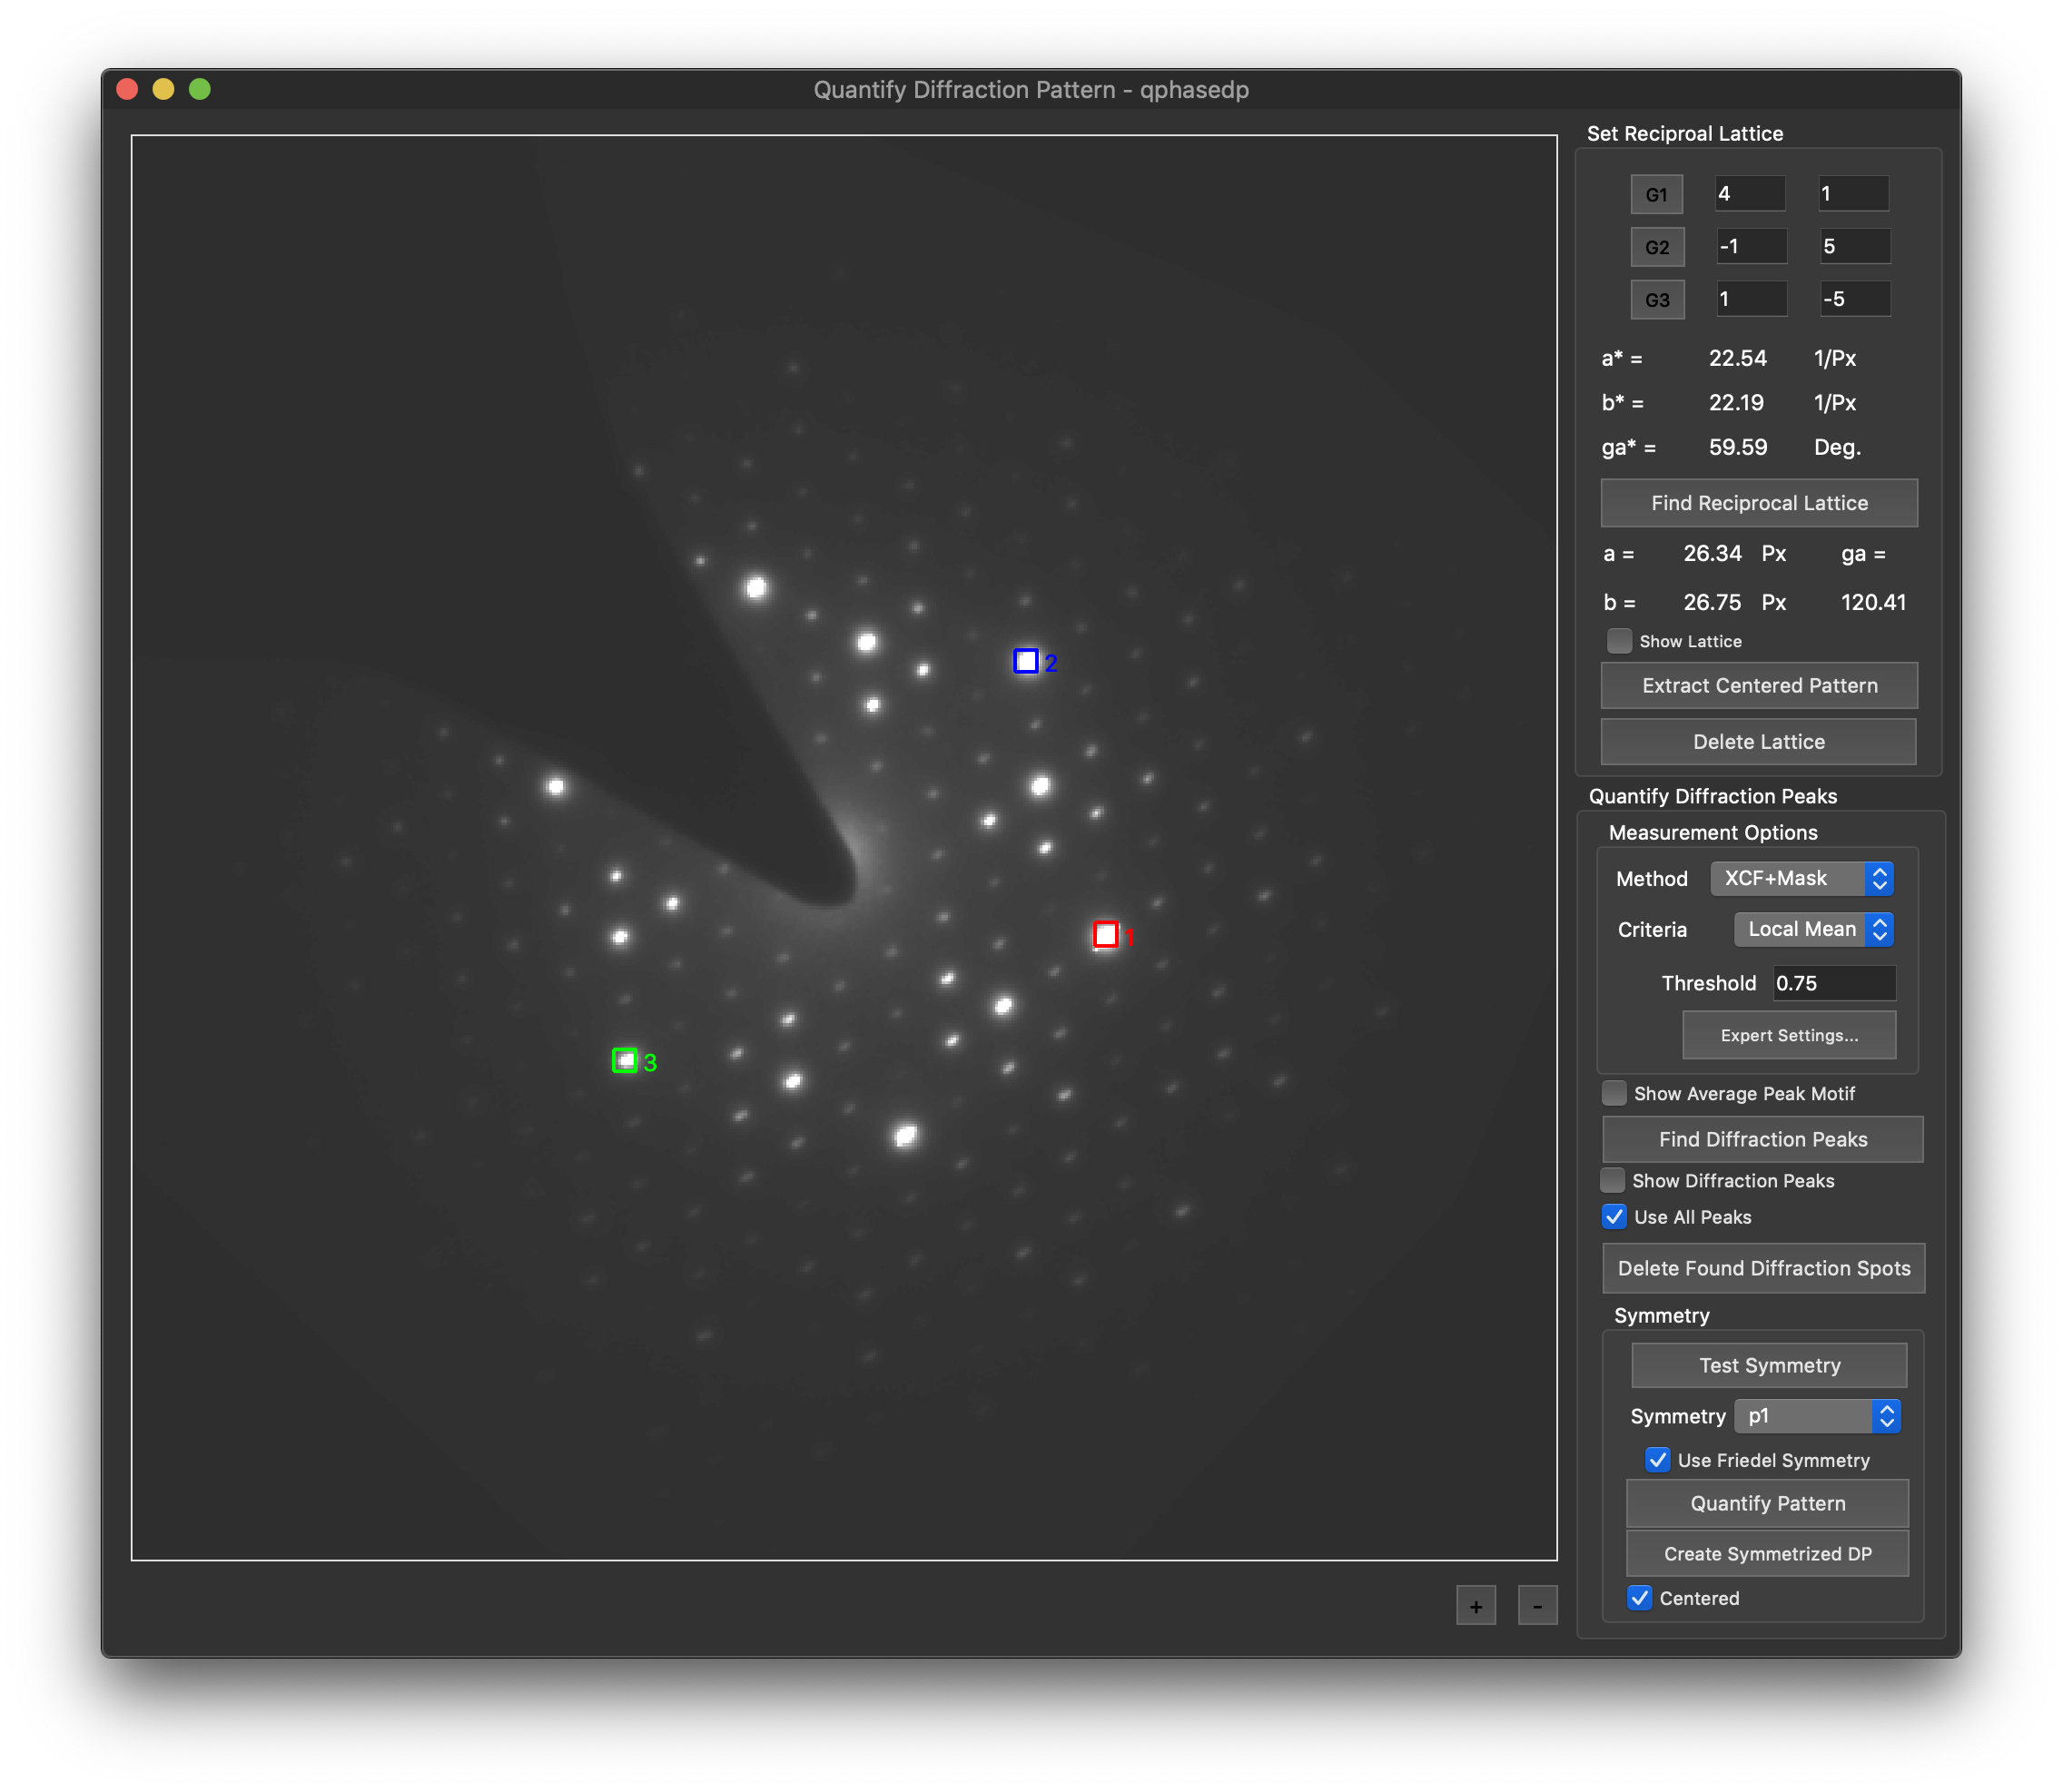
The Control Window serving as a starting point for extracting quantitative data from experimental diffraction patterns
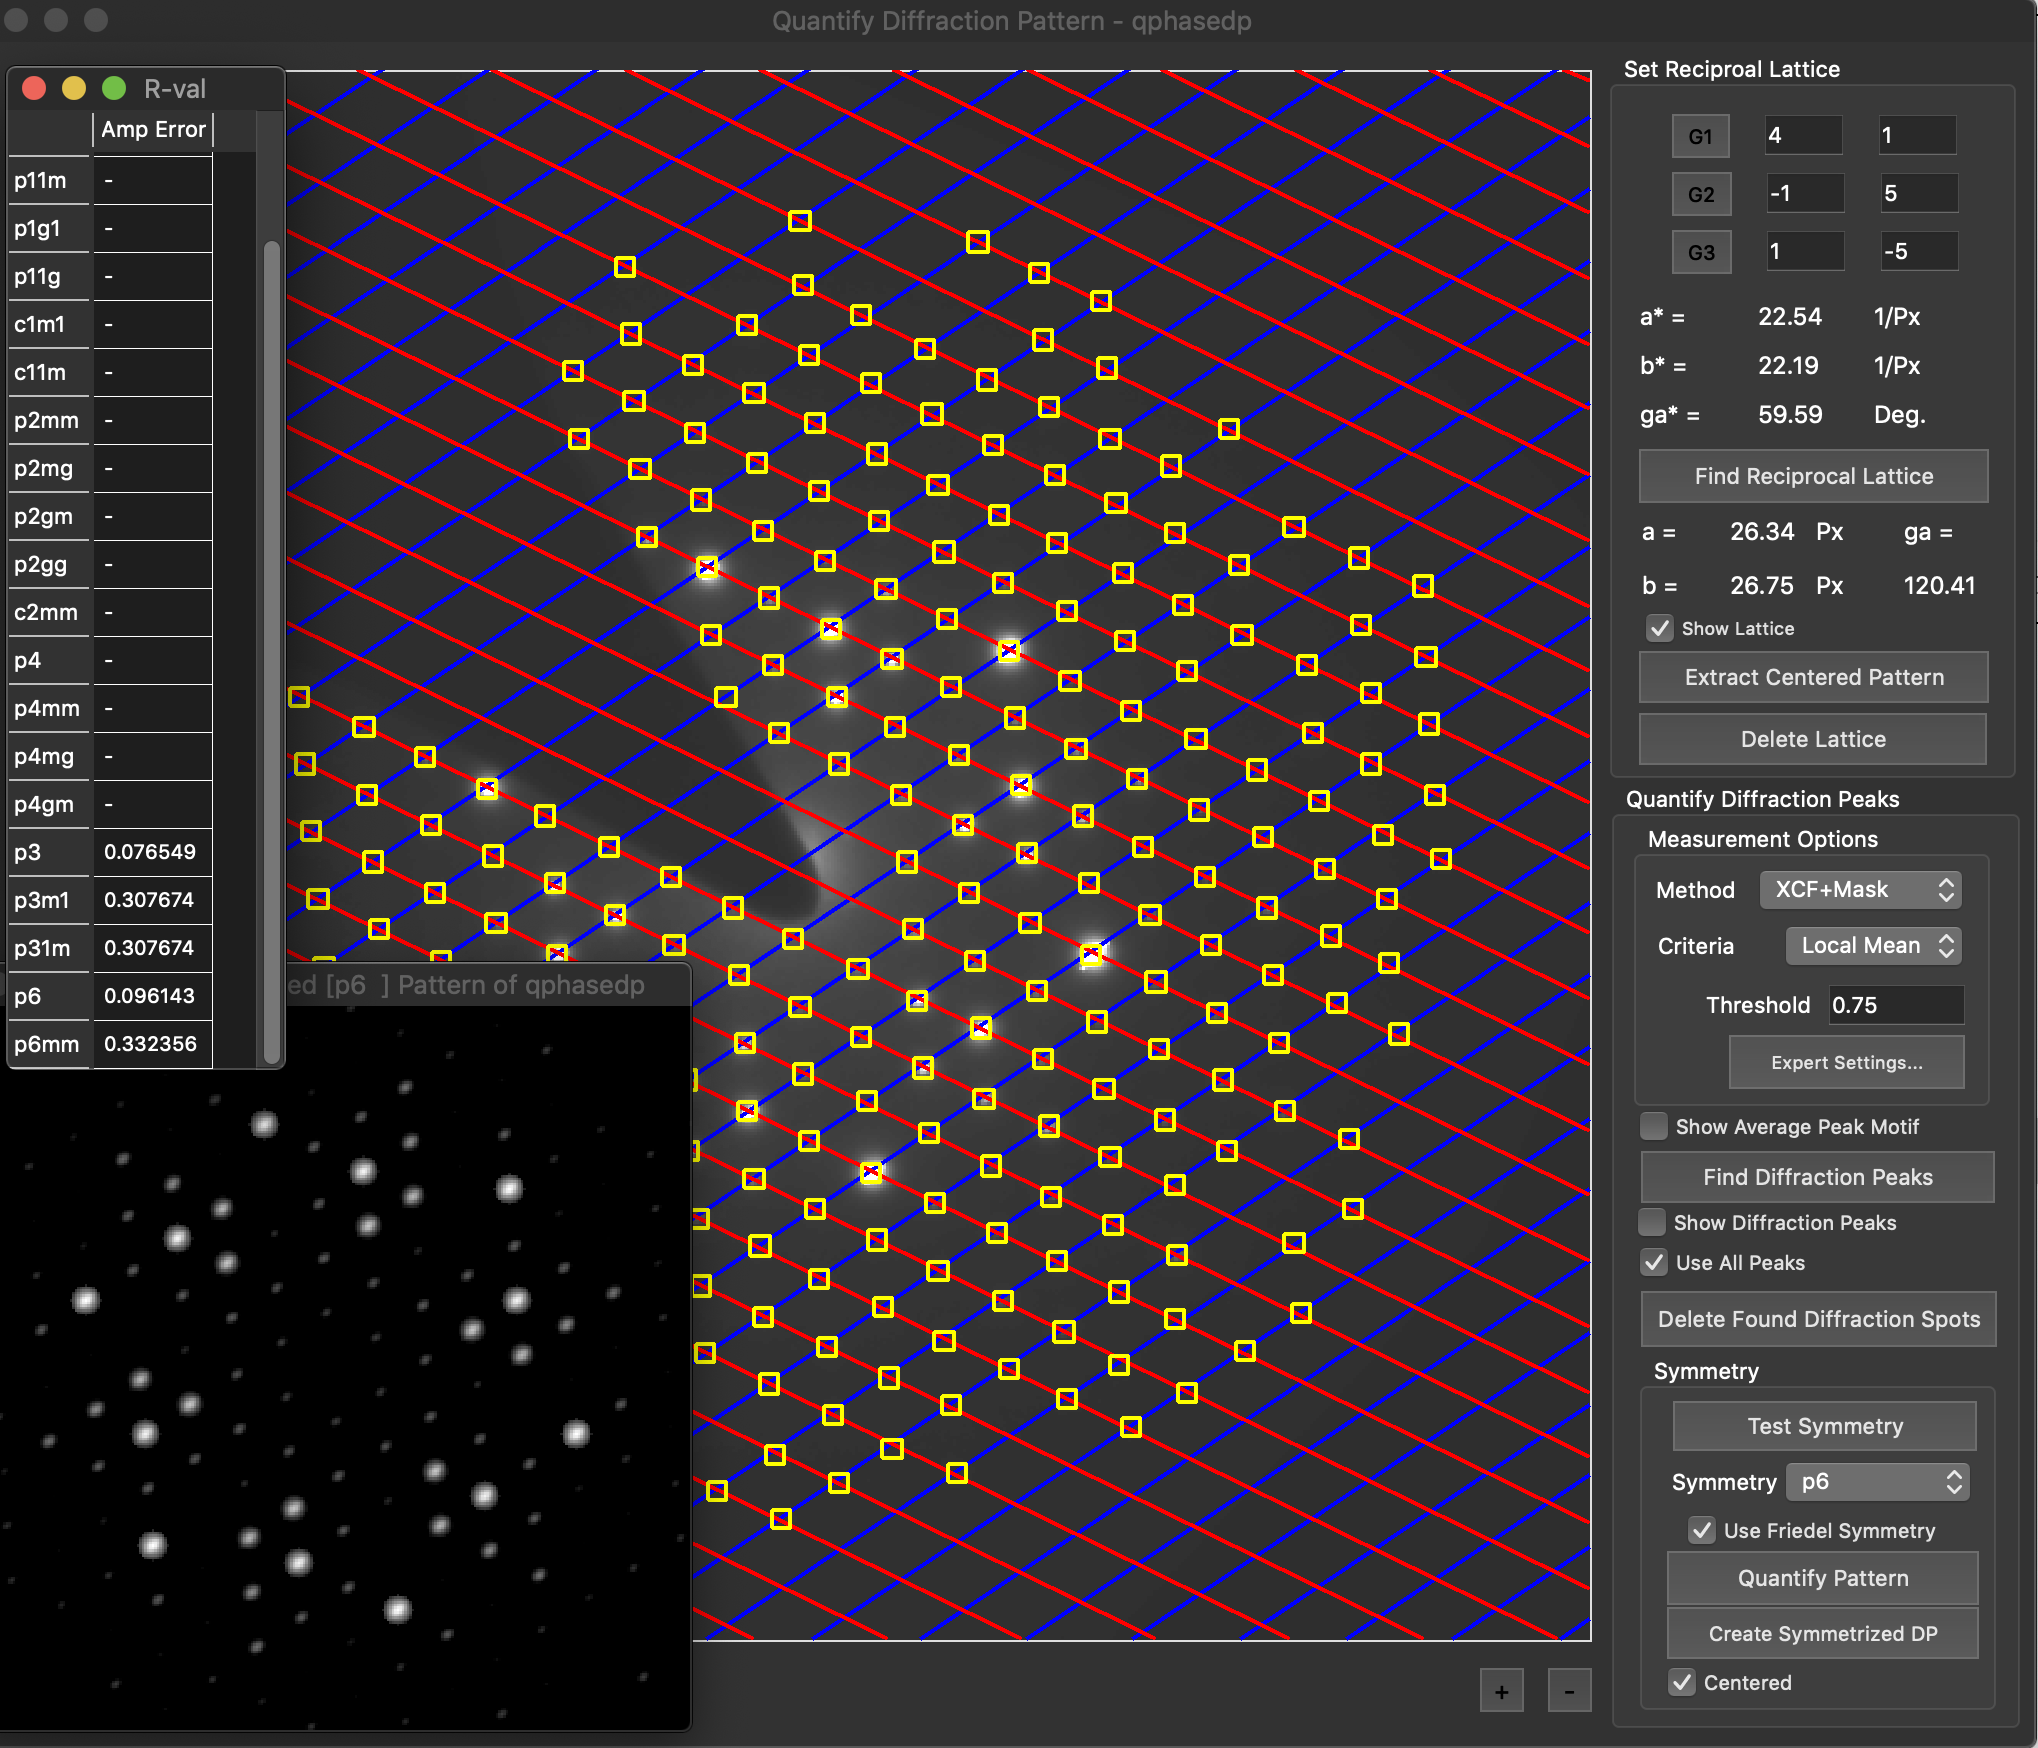
Peak information extracted from the diffraction spots at the determined lattice
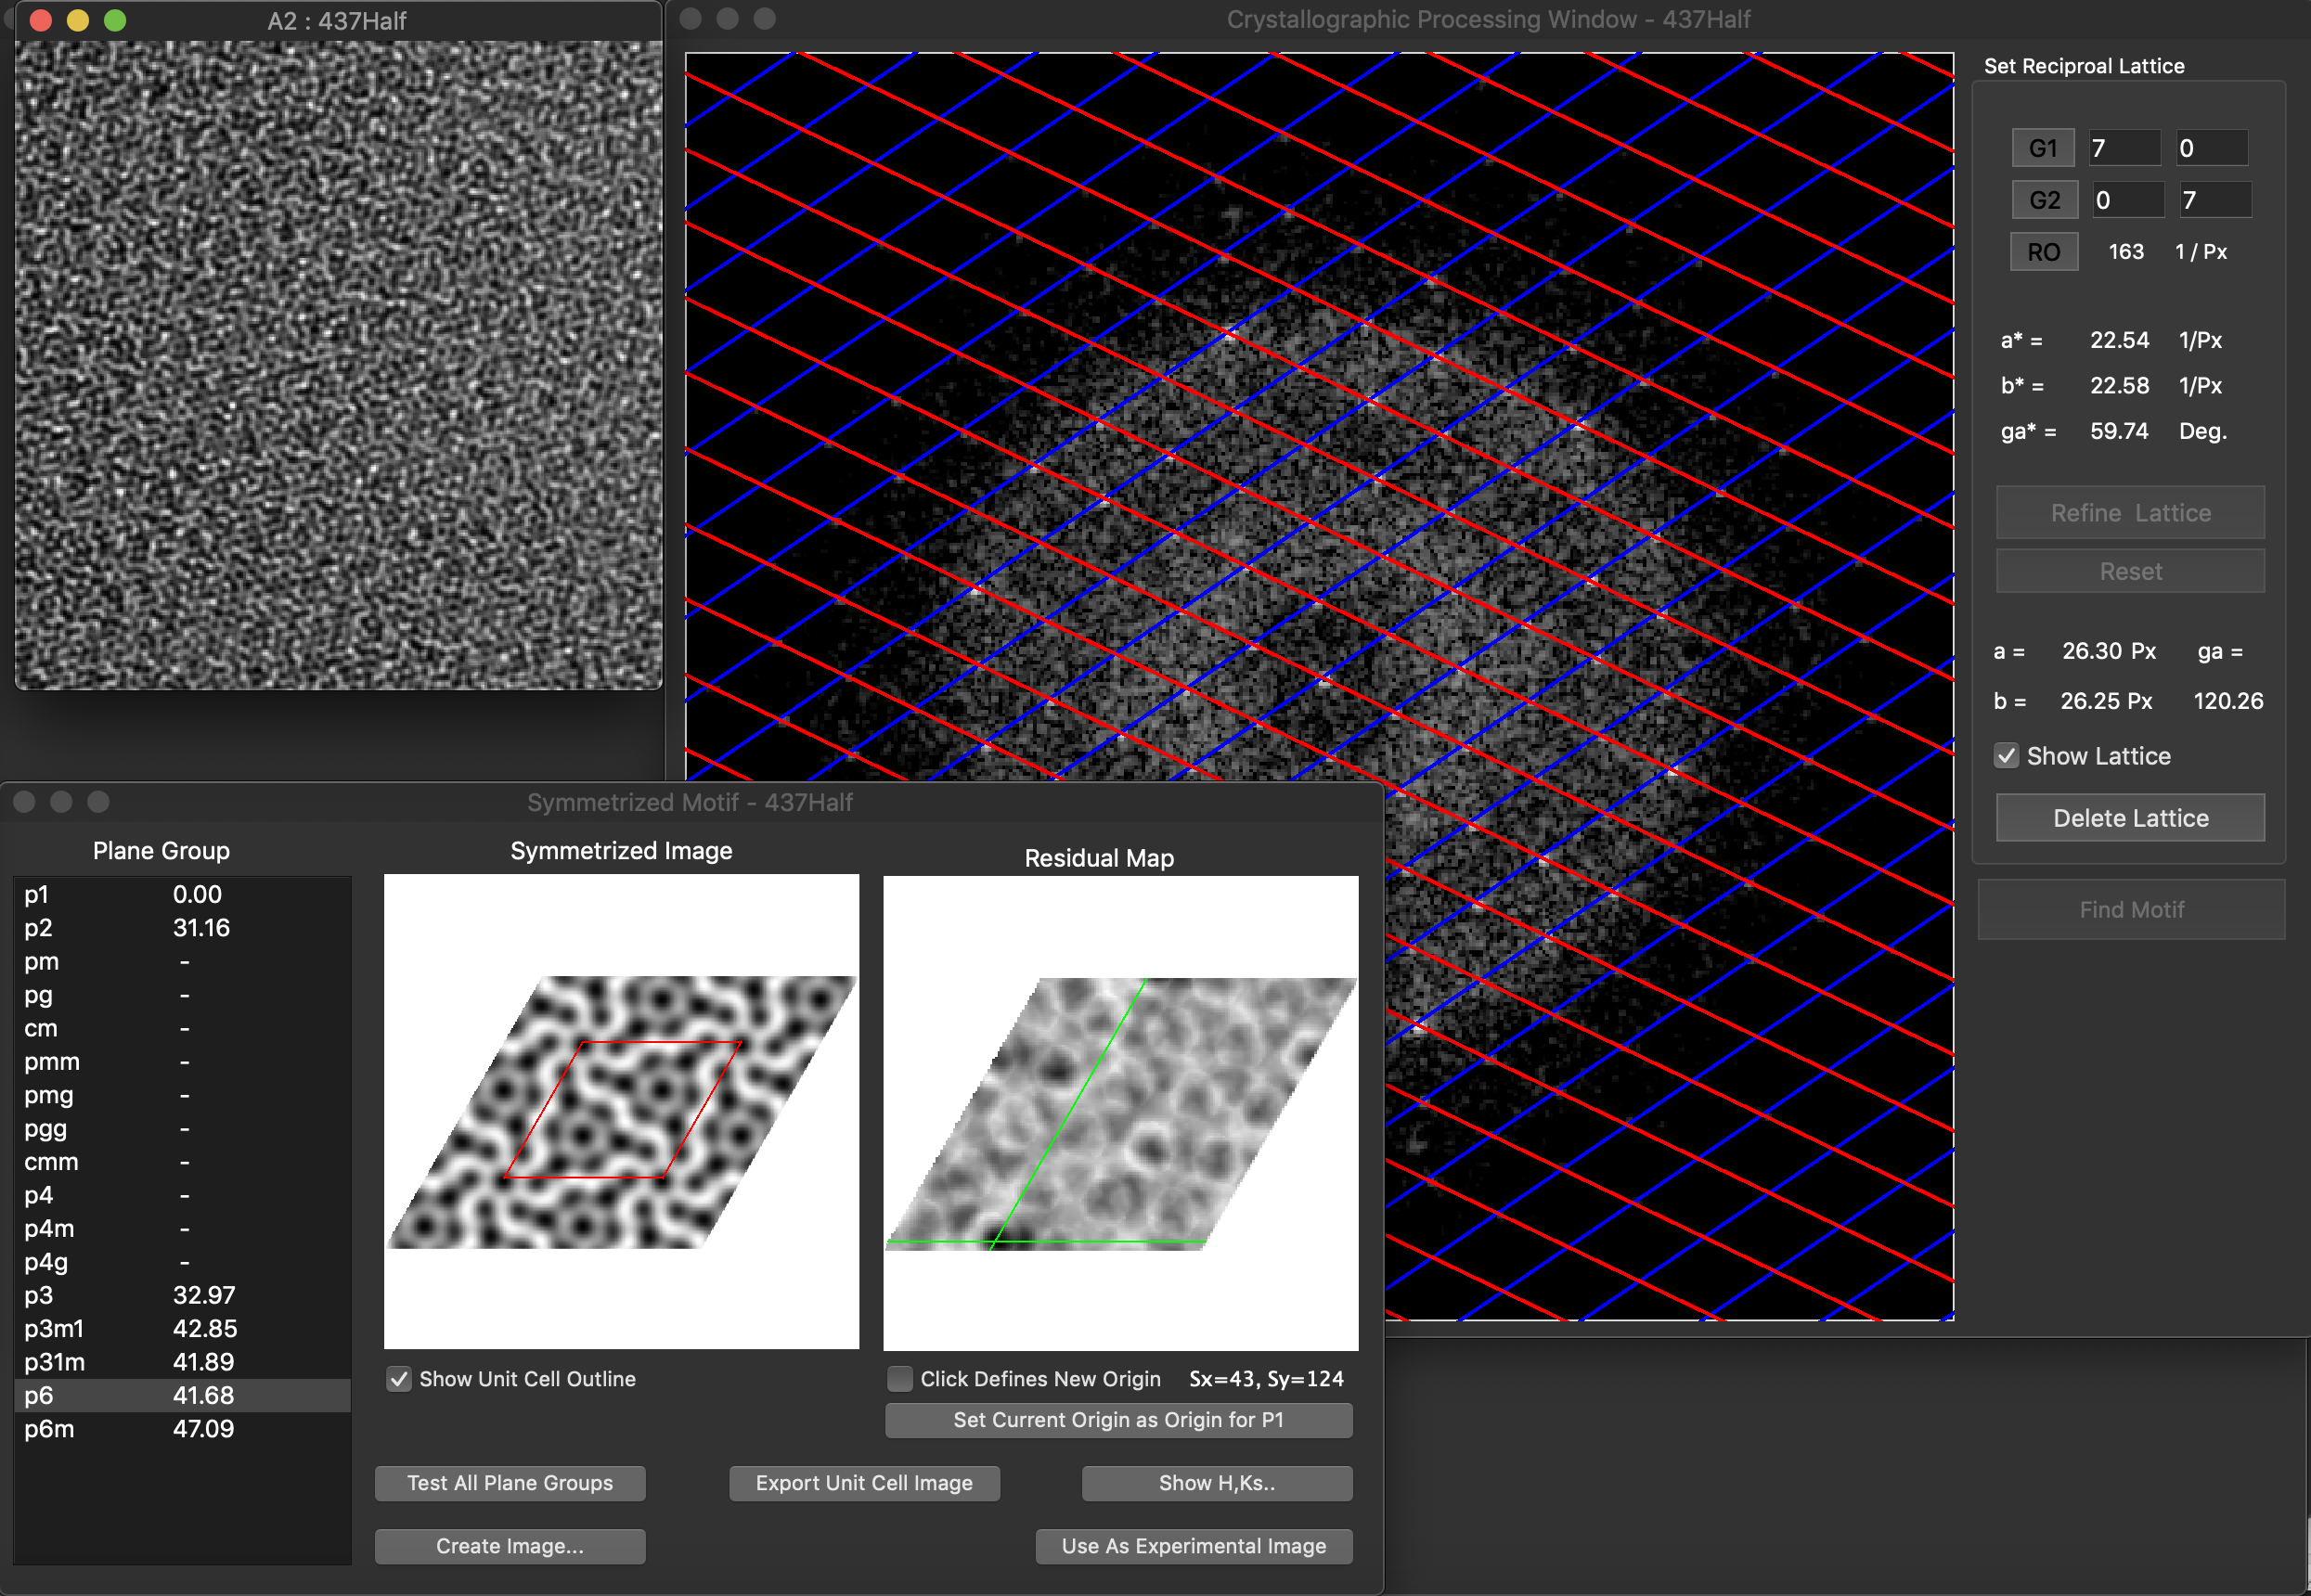
Crystallographic Image Processing using symmetrized data from the 2D-Periodic Unit Cell
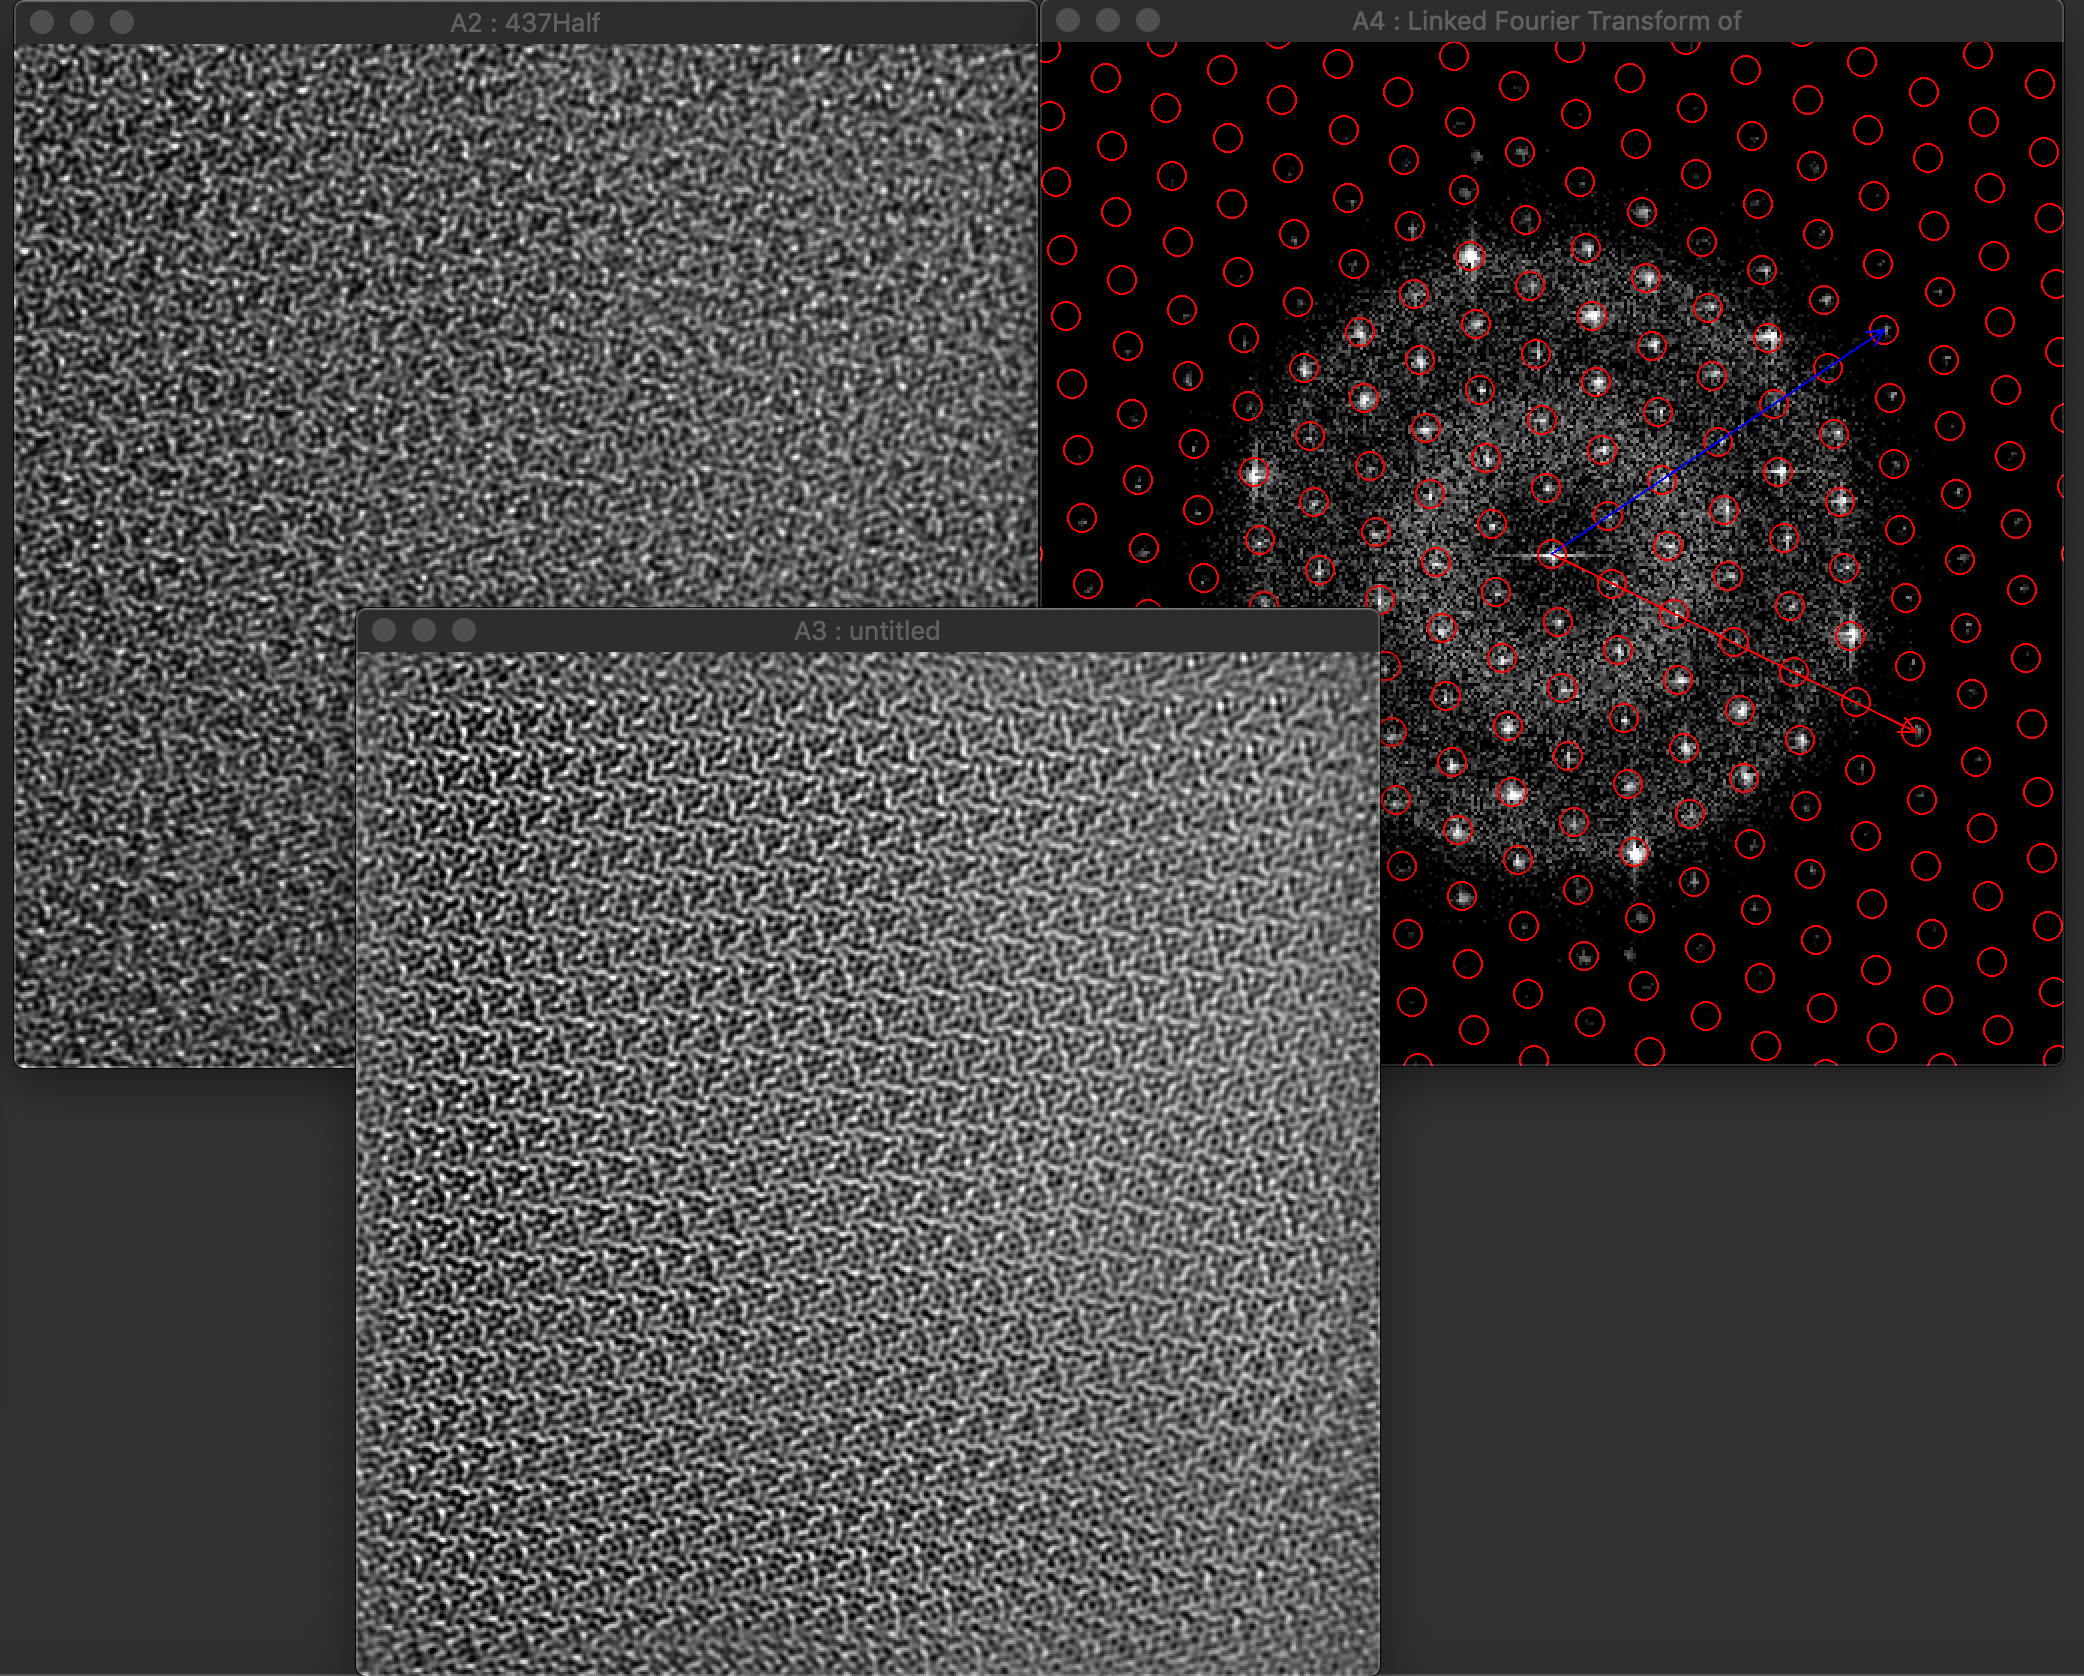
Fourier Image Processing using a periodic lattice mask
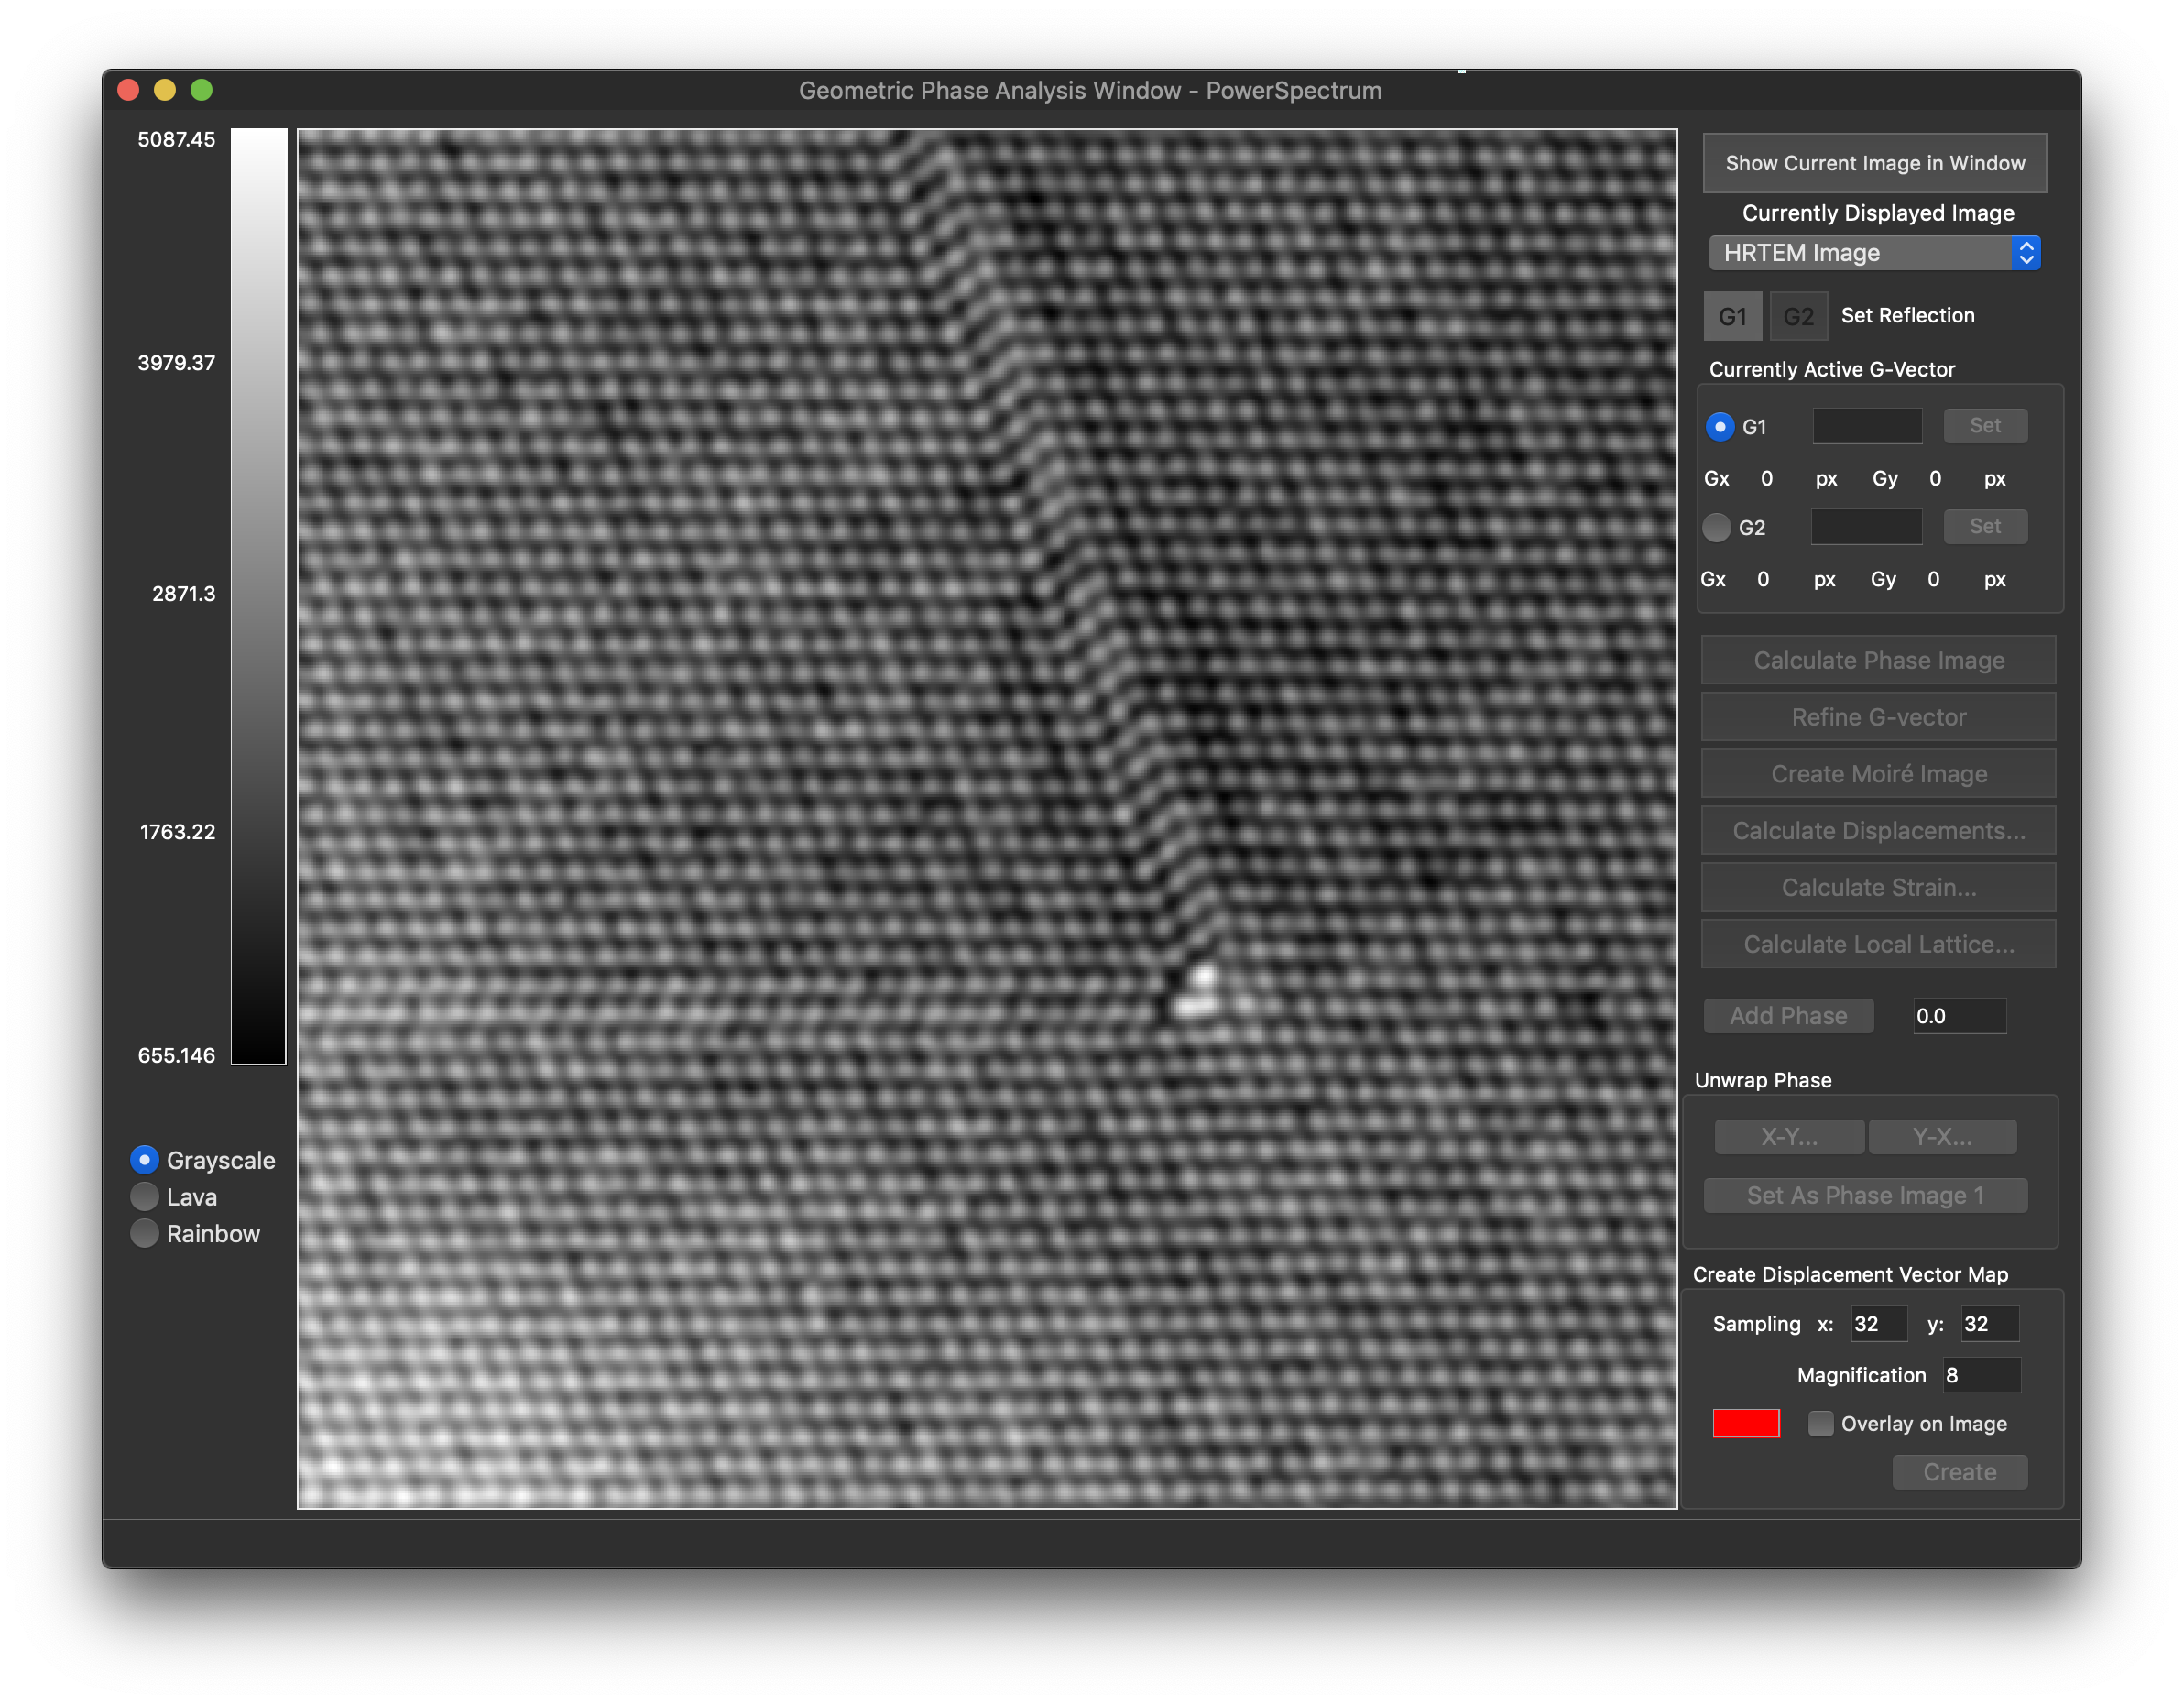
Geometric Phase Analysis using data from information around diffracted spots to determine lattice deviations and strain
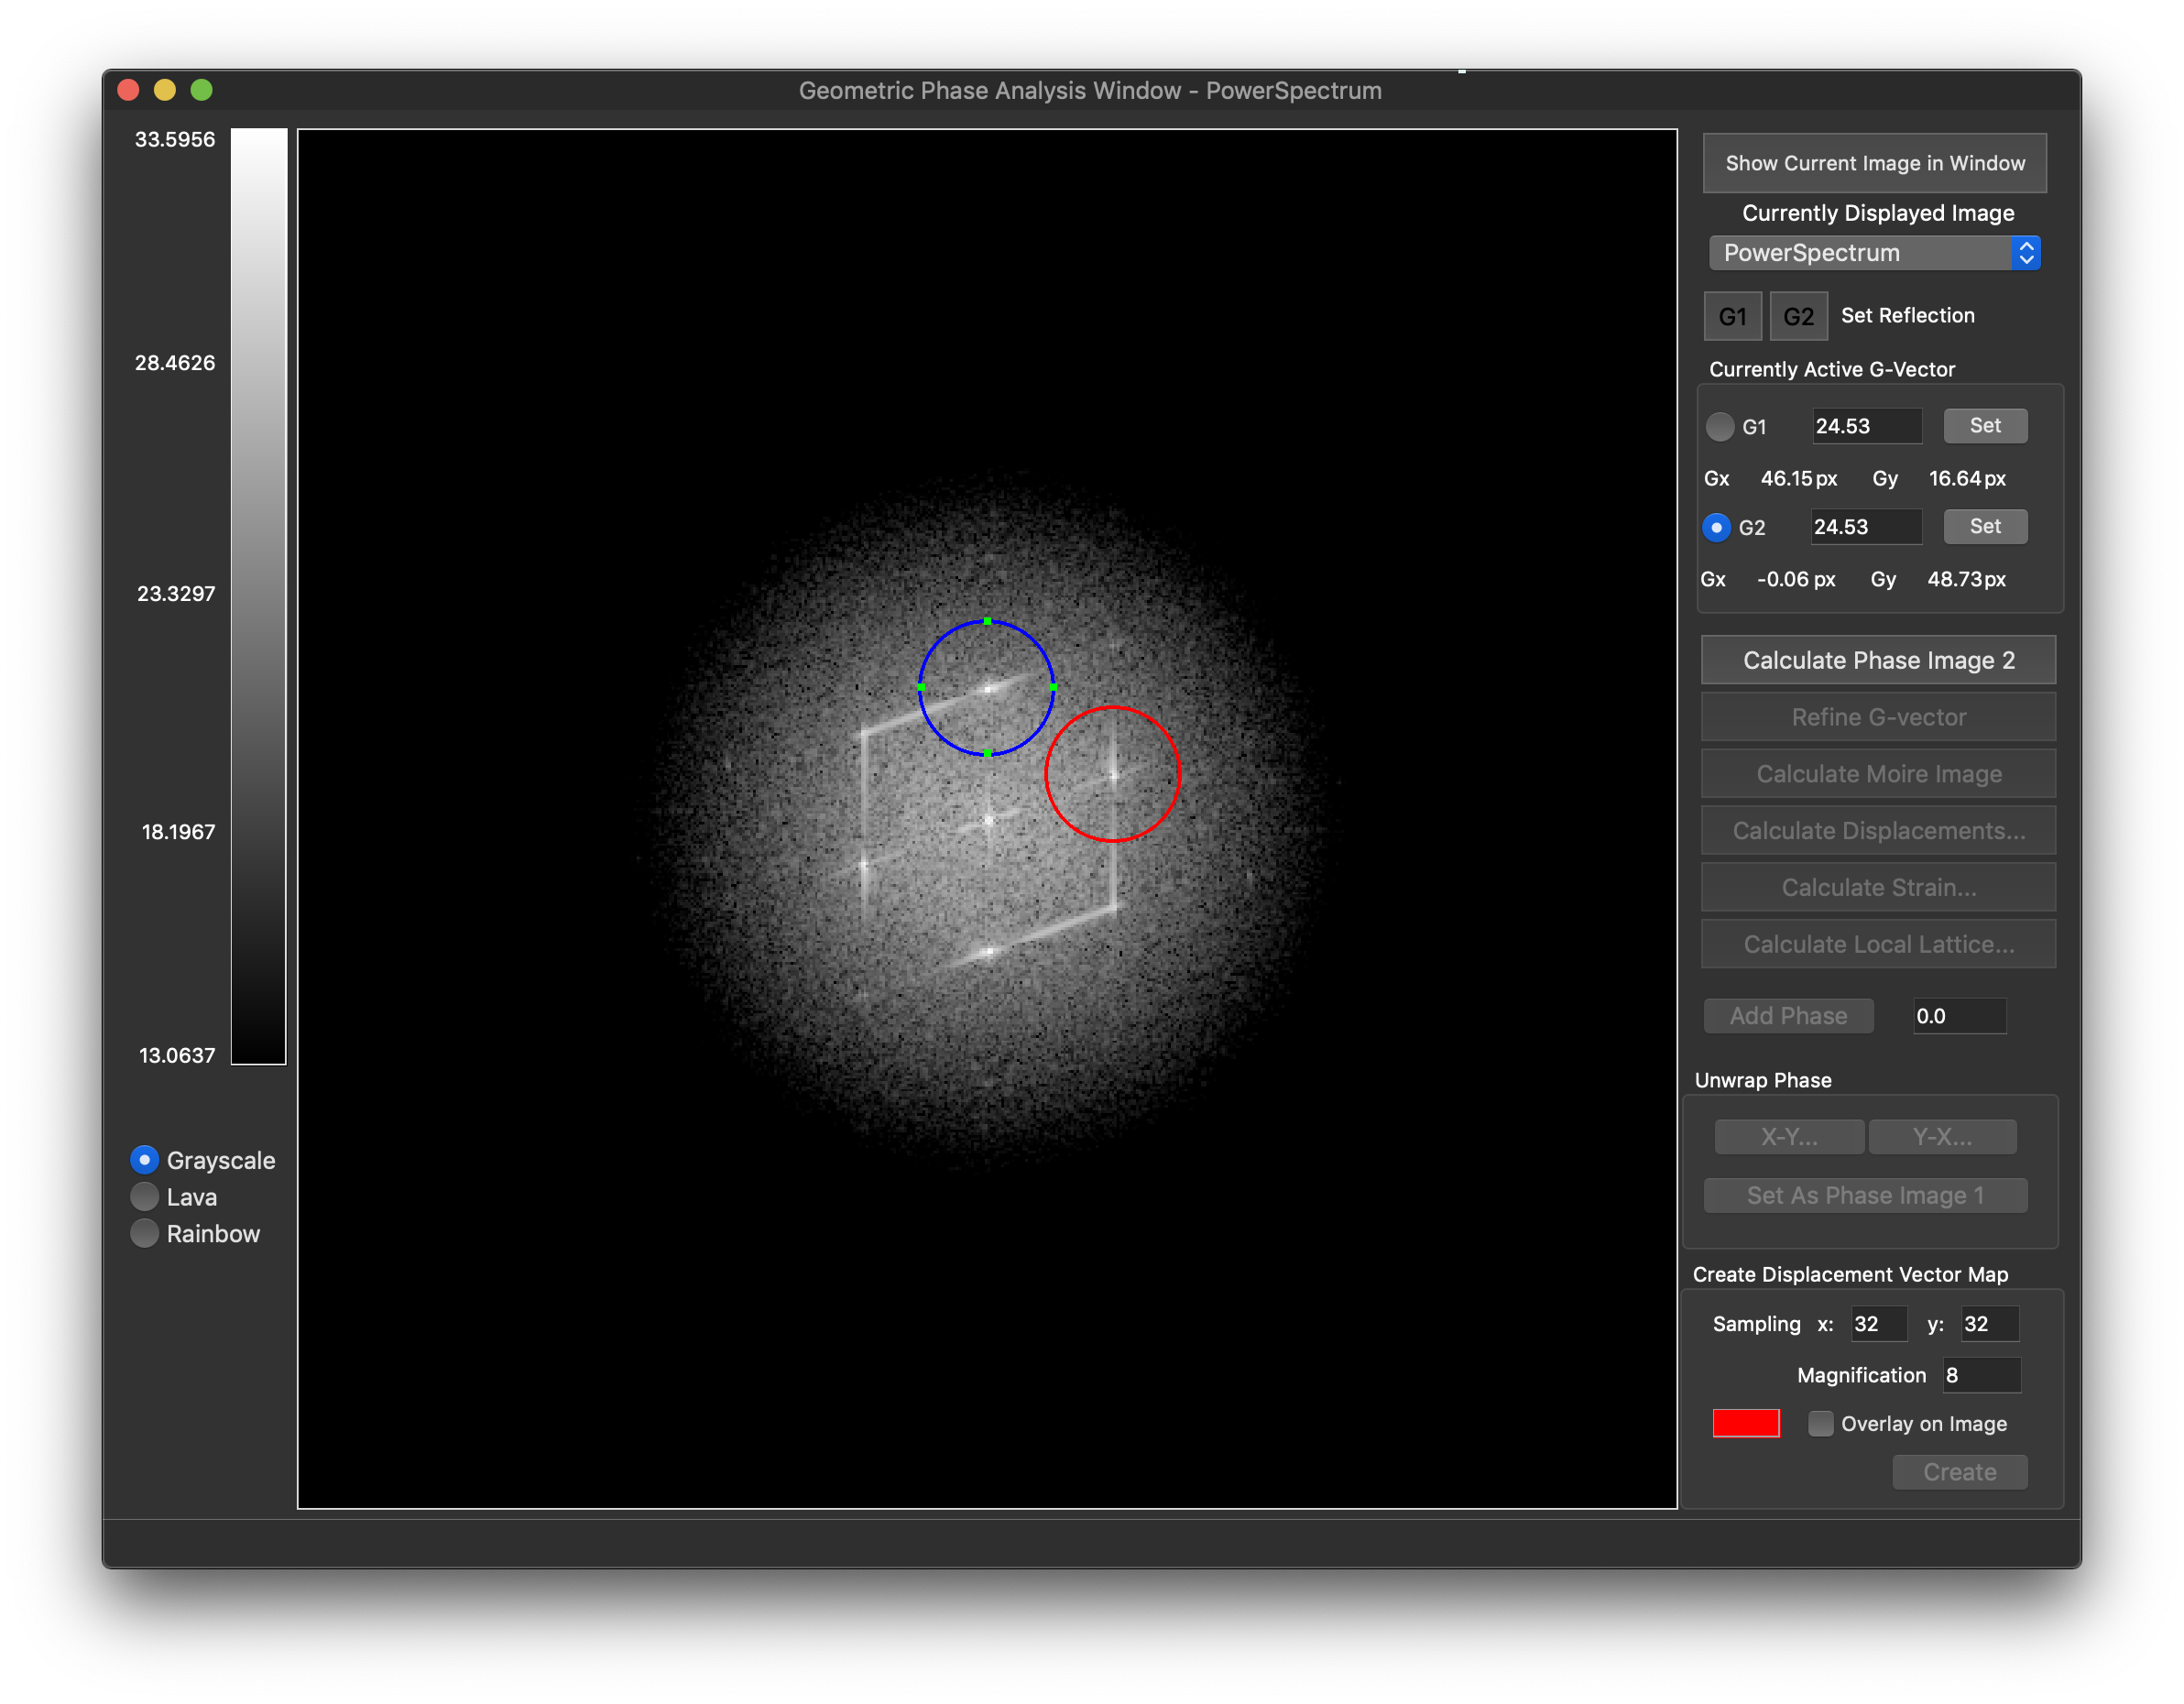
Geometric Phase Analysis showing the reference lattice vectors used in the analysis
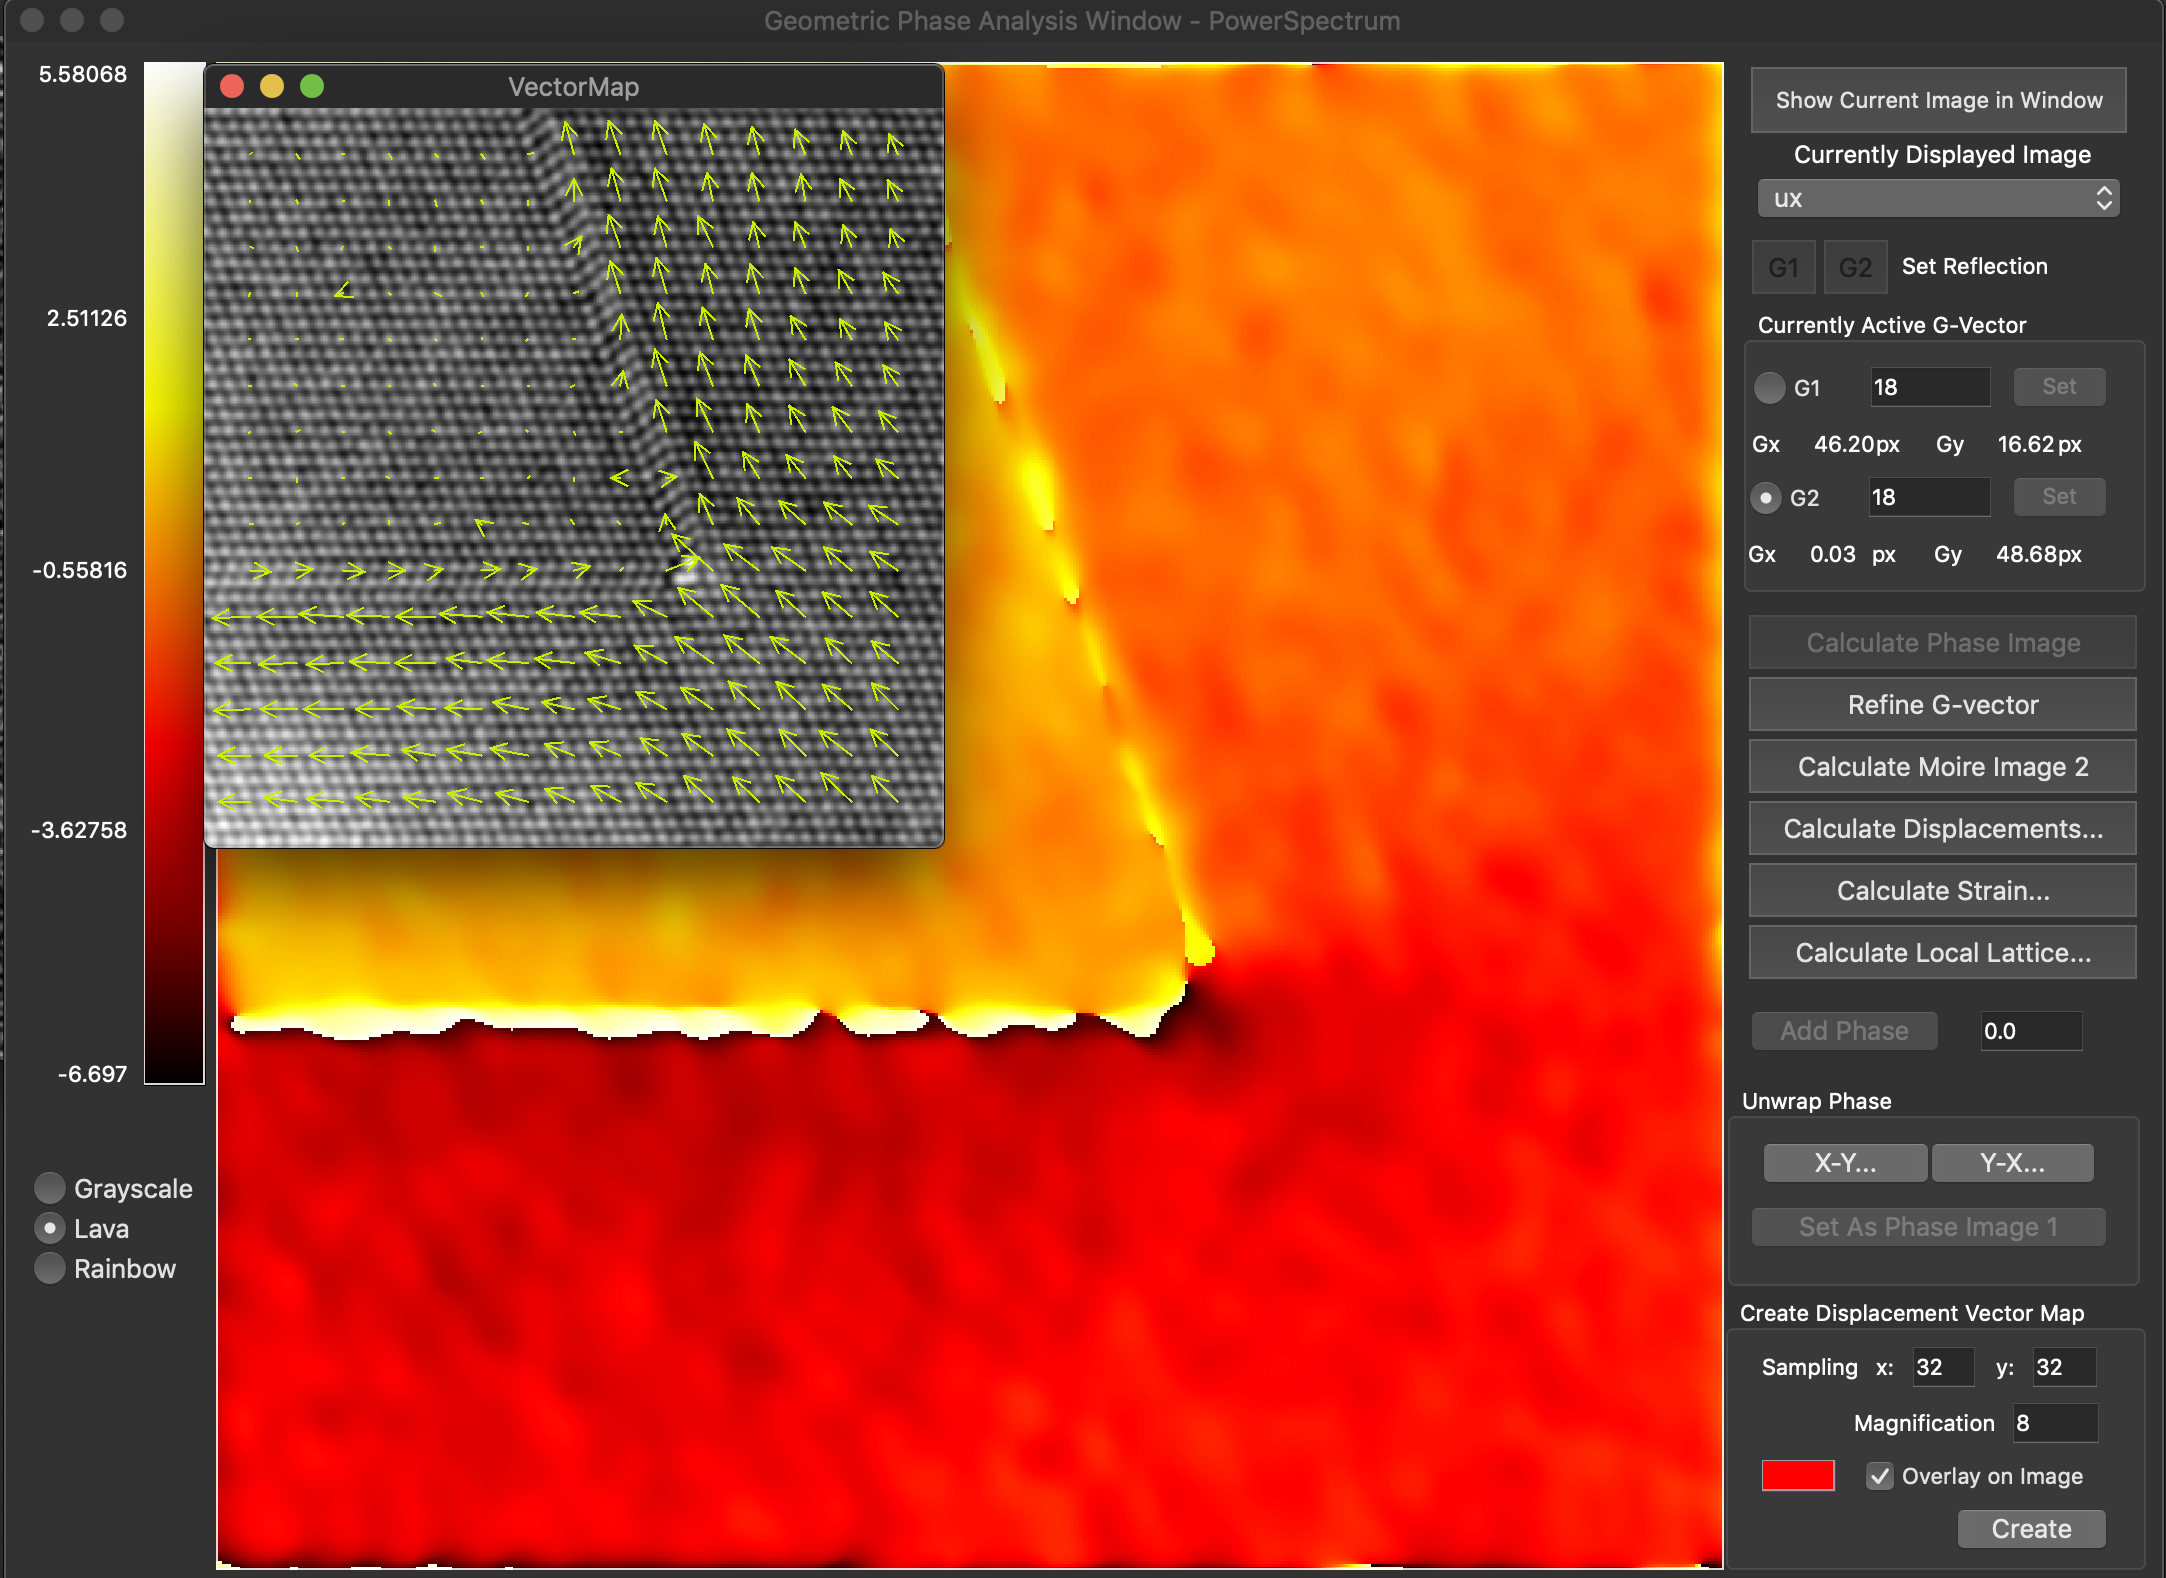
Geometric Phase Analysis showing a pseudo colored depiction of the deviations from a reference lattice in the x-direction together with a vector map showing the 2D deviations from the same lattice.
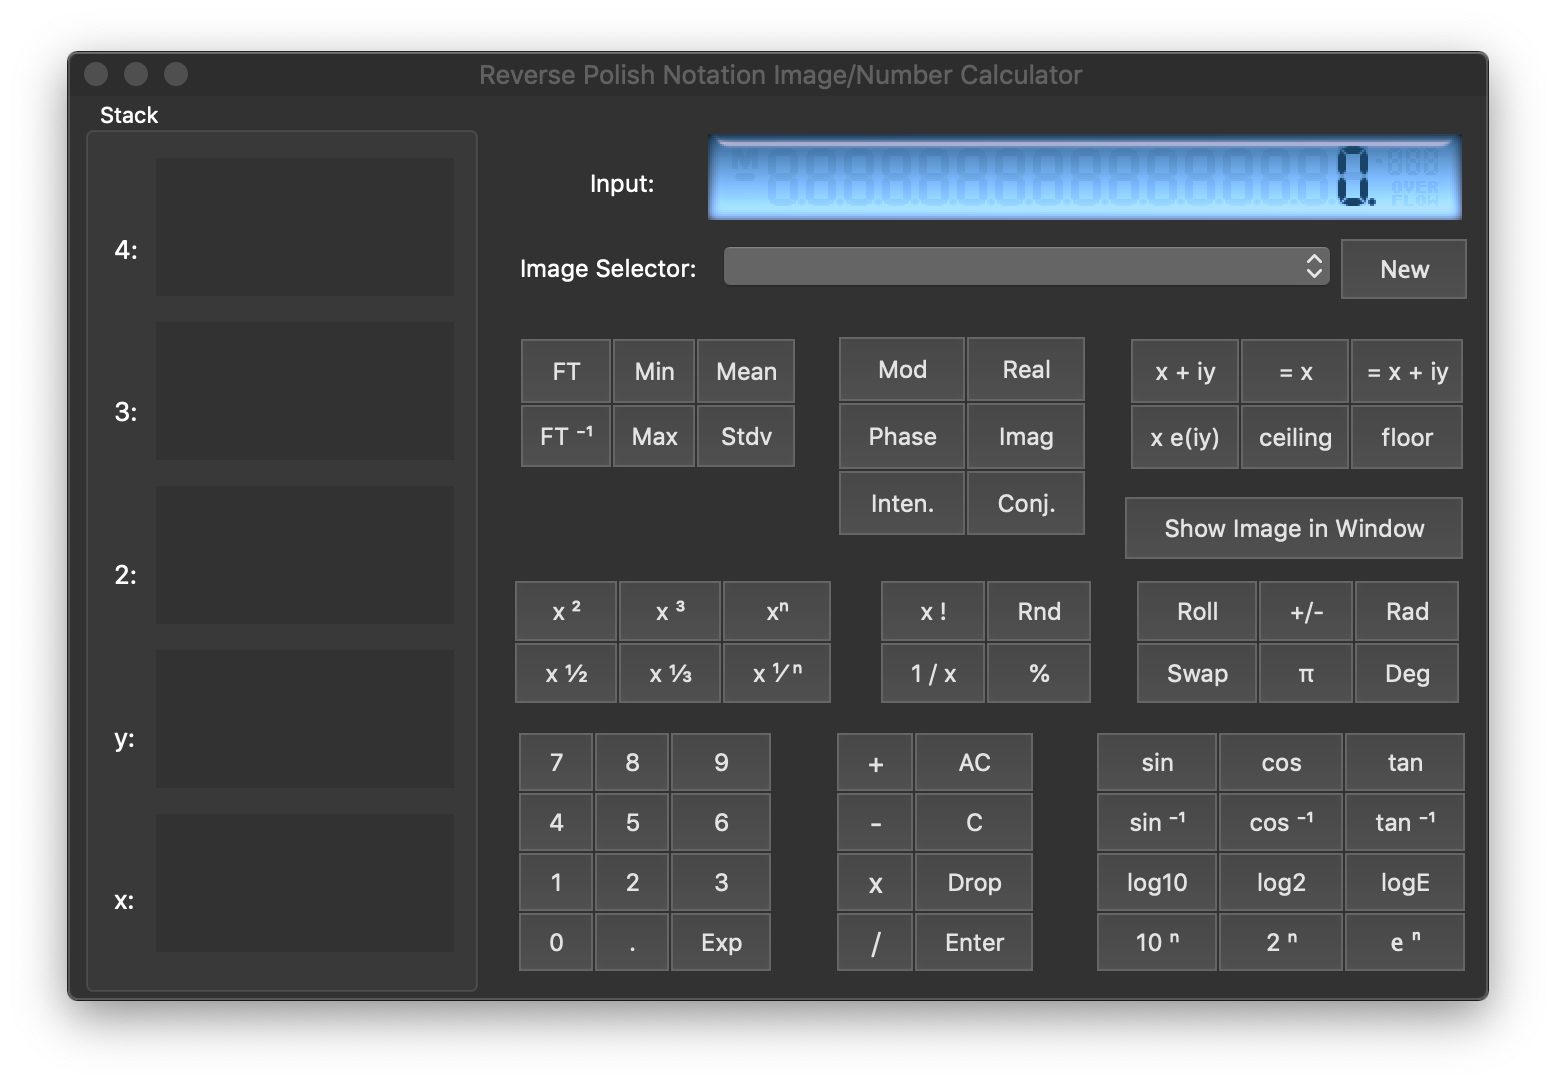
The built in Reverse Polish Notation Calculator which operates on real and complex images as well as real and complex numbers
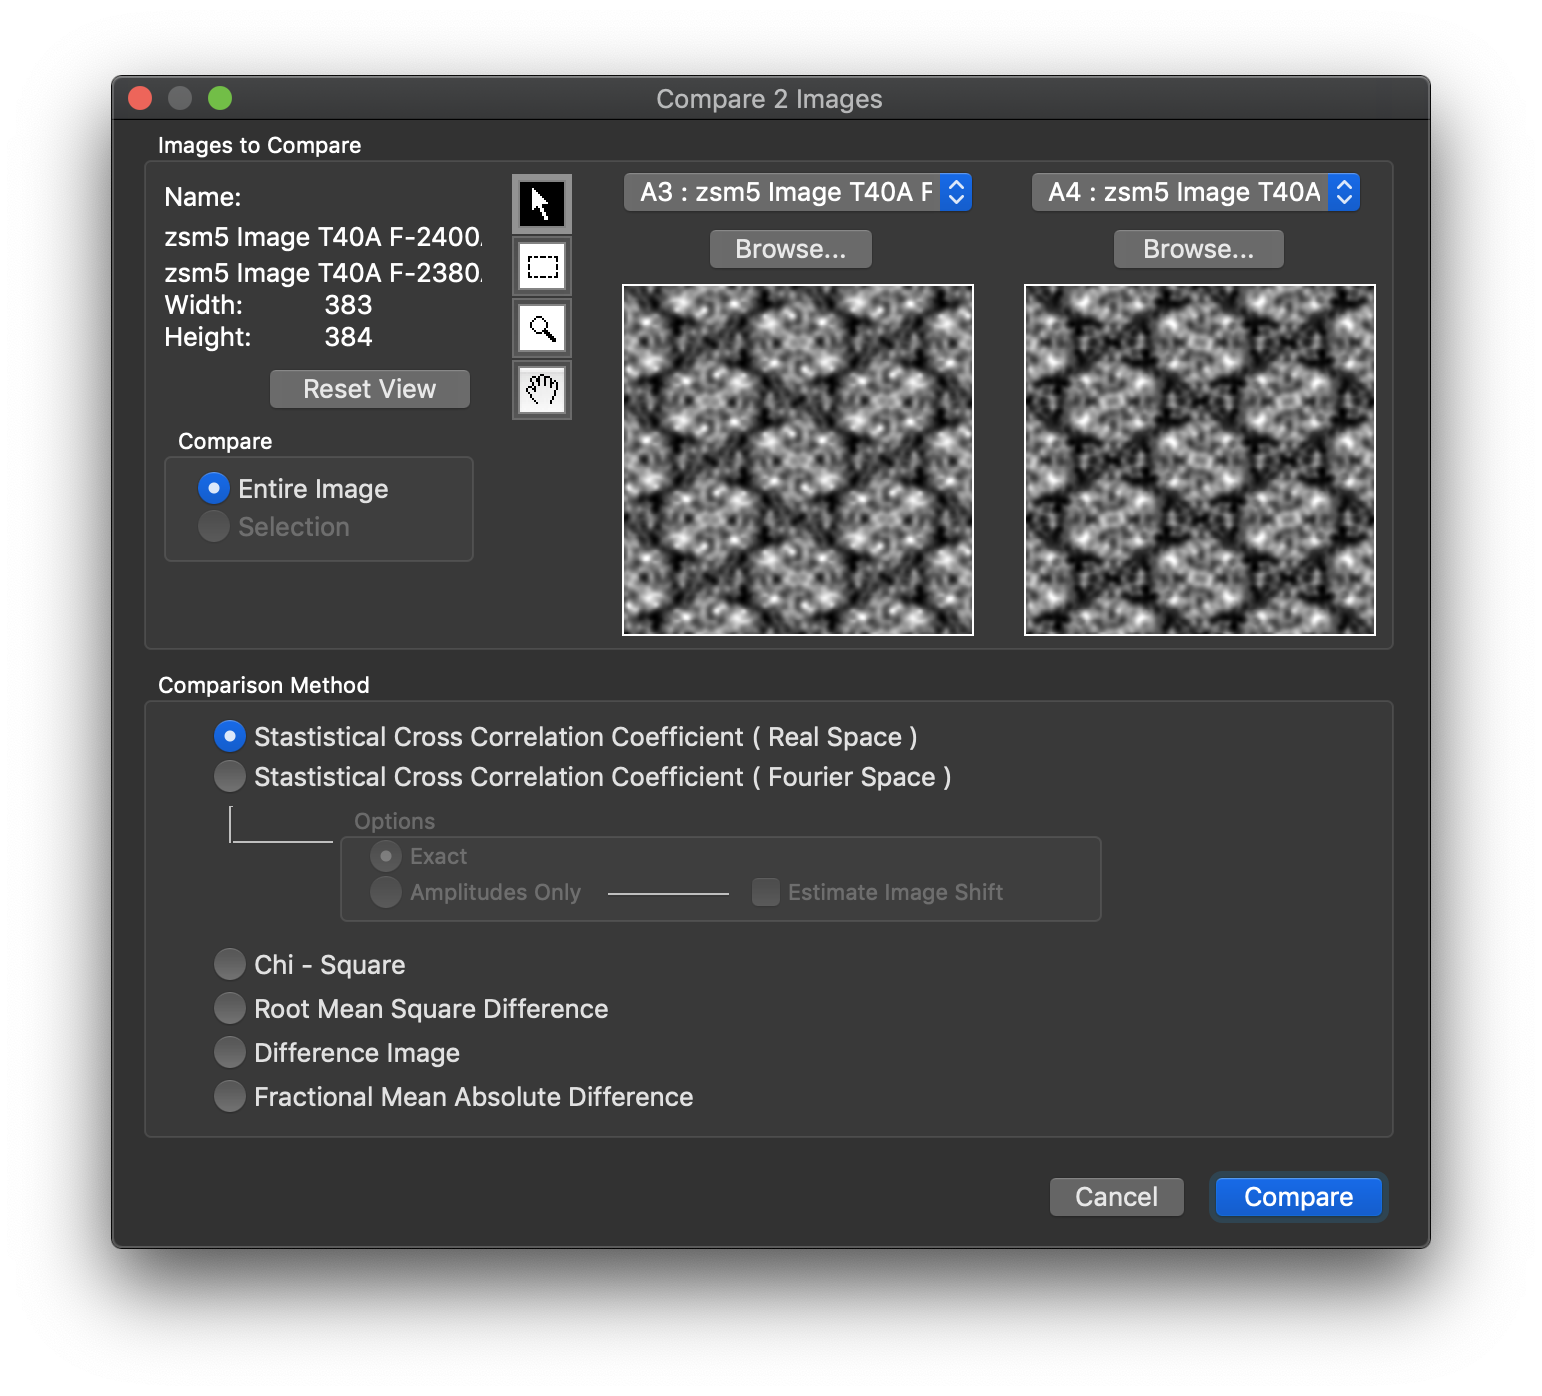
Comparing two images using different matching criteria.